This pixel image of NASA's Webb Telescope was created using a vintage Macintosh computer.Anthony Chan / NASA Astrobiology Program
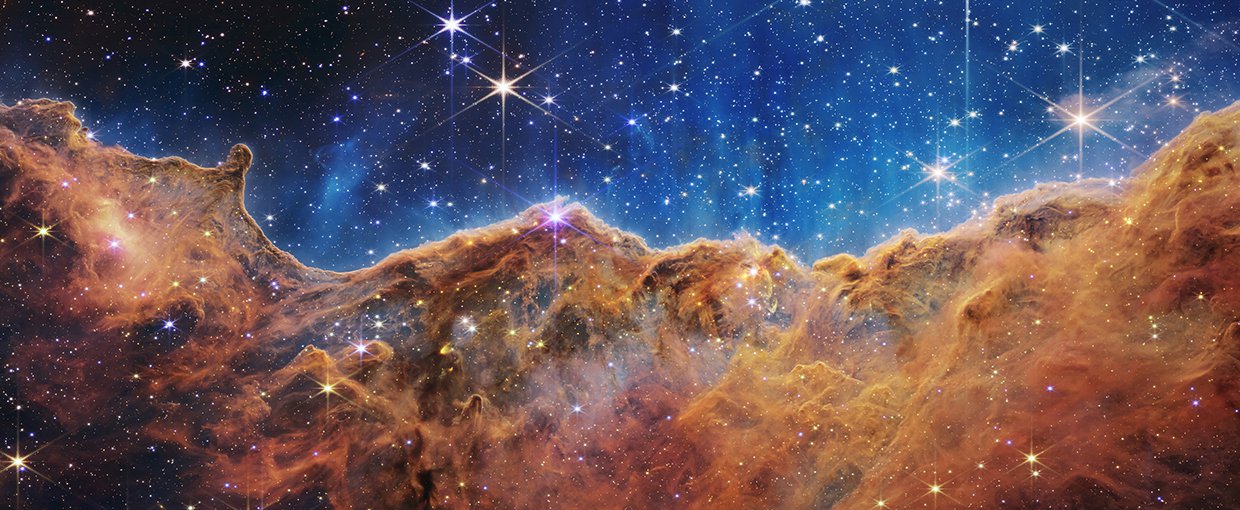
The edge of a nearby, young, star-forming region called NGC 3324 in the Carina Nebula as captured in infrared light by NASA’s Webb Space Telescope. This image reveals for the first time previously invisible areas of star birth.NASA, ESA, CSA, and STScI
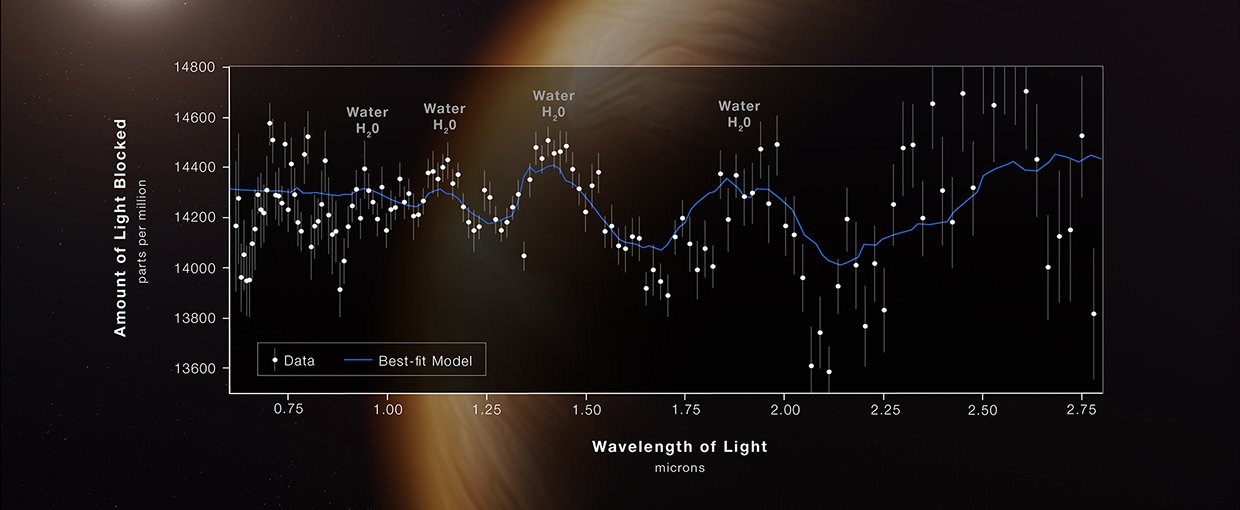
NASA’s James Webb Space Telescope has captured the distinct signature of water, along with evidence for clouds and haze, in the atmosphere surrounding a hot, puffy gas giant planet orbiting a distant Sun-like star.NASA, ESA, CSA, and STScI
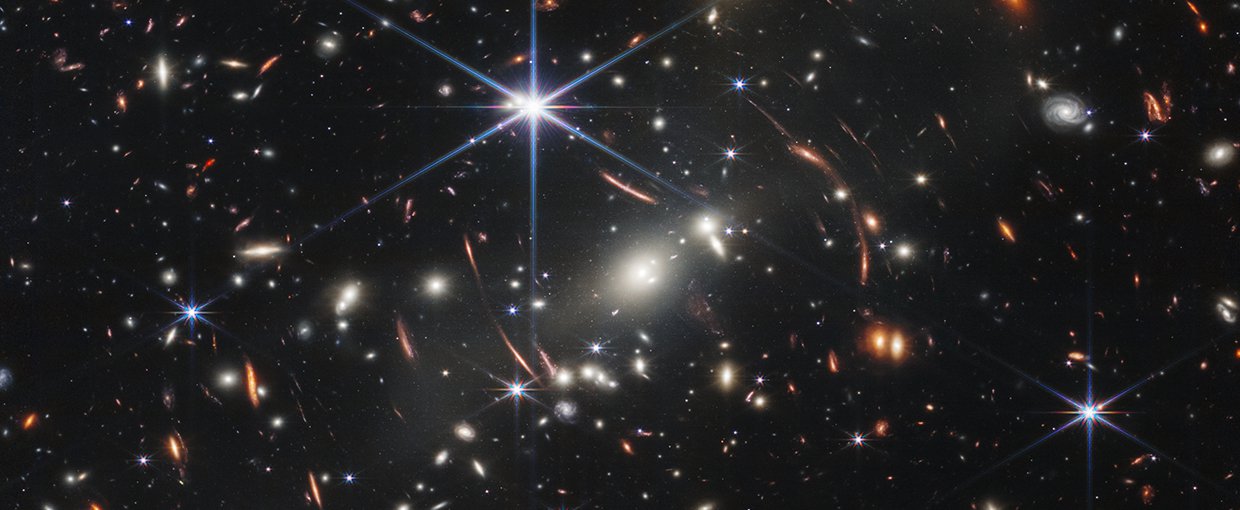
NASA’s James Webb Space Telescope has delivered the deepest and sharpest infrared image of the distant universe so far. Webb’s First Deep Field is galaxy cluster SMACS 0723, and it is teeming with thousands of galaxies – including the faintest objects ever observed in the infrared.NASA, ESA, CSA, and STScI
In 1610, Galileo Galilei peered through a telescope and observed, “I have seen Jupiter accompanied by three fixed stars, totally invisible by their smallness. The planets are seen very rotund, like little full moons (1).” In fact, what he saw with his eyes, magnified by his early telescope, were the largest moons of our solar system’s largest planet, Jupiter. Galileo eventually identified Europa, Callisto, Io, and Ganymede, and they are now sometimes known as Jupiter’s ‘Galilean’ satellites.
Today, Galileo’s telescope would seem rudimentary next to the much larger and more powerful instruments that astronomers use. Recently, the most powerful space telescope ever built and launched by humankind released its first images to the public.
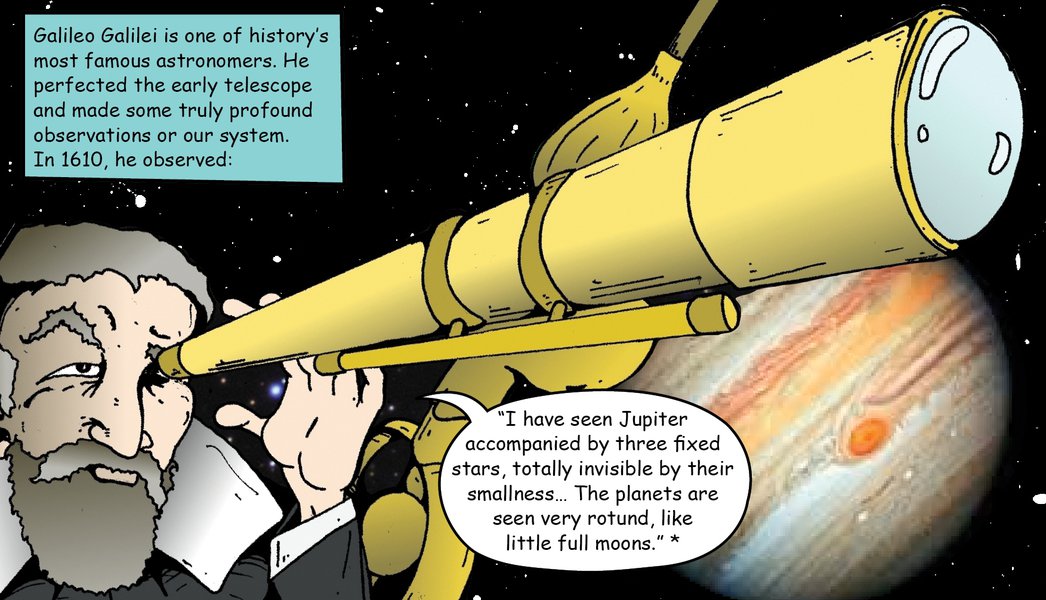
Galileo from Issue 1 of Astrobiology: The Story of Our Search for Life in the Universe. Available at: astrobiology.nasa.gov/resources/graphic-histories/
(*) Drake, S. (1978) Galileo at Work: His Scientific Biography, University of Chicago PressImage credit: NASA Astrobiology.
(*) Drake, S. (1978) Galileo at Work: His Scientific Biography, University of Chicago PressImage credit: NASA Astrobiology.
For anyone interested in astronomy and astrobiology, what does a mission like the Webb space telescope mean? The Webb telescope is not designed to look for life but could unlock important information about the habitability of exoplanets and thus the potential for life beyond our solar system. But what does ‘looking’ through a telescope like Webb actually entail for scientists today? Jacob Lustig-Yaeger, Erin May, and Laura Mayorga, three early-career scientists from the Johns Hopkins Applied Physics Lab, help to explain what life is like as an astronomer today.
“Have you ever seen a rainbow dancing on your wall because of light shining through your window? That’s a spectrum!”
What does the data from a space telescope like Webb actually look like for an astrobiologist?
The telescope has many operating modes that astronomers will use for different astronomical investigations. Some of the modes are imaging that will capture stunning details of various objects, similar to the galaxies and nebulae that the Hubble Space Telescope observed. But for astronomers who study exoplanets in other planetary systems (known as exoplanets), we’re particularly interested in the mission’s spectroscopic capabilities.
Have you ever seen a rainbow dancing on your wall because of light shining through your window? That’s a spectrum! A spectrum is a way of breaking up light into all the colors that it’s made of so we can better study it. The colorful rainbow we’re most familiar with is what happens when you break up sunlight, which is visible to your eyes. But light is also made up of a lot more “colors” than just what our eyes can see. This telescope looks for “rainbows” of infrared light, which is just heat – the type of light that makes the Sun or a hot furnace feel warm.
This pixel image of NASA's Webb Telescope was created using a vintage Macintosh computer.Image credit: Anthony Chan / NASA Astrobiology Program.
The telescope isn’t your typical camera, though: Its cameras are made up of pixels that are sort of like a bunch of buckets set up in a grid, like an ice tray. After the instruments break the light up into that infrared rainbow, each bucket starts filling up with a specific color of light. Each bucket counts the amount of light that enters it until it fills up, or we tell the telescope to stop collecting light.
In reality, the actual data is just a bunch of numbers telling us how much light the telescope observed in the specific colors we wanted to collect. The “image” we get back really just appears as a big black and white stripe, but that’s our infrared rainbow! For exoplanets, we often take lots of these pictures, one after another, to see how those colors change over time when the exoplanet crosses in front of or behind its star.
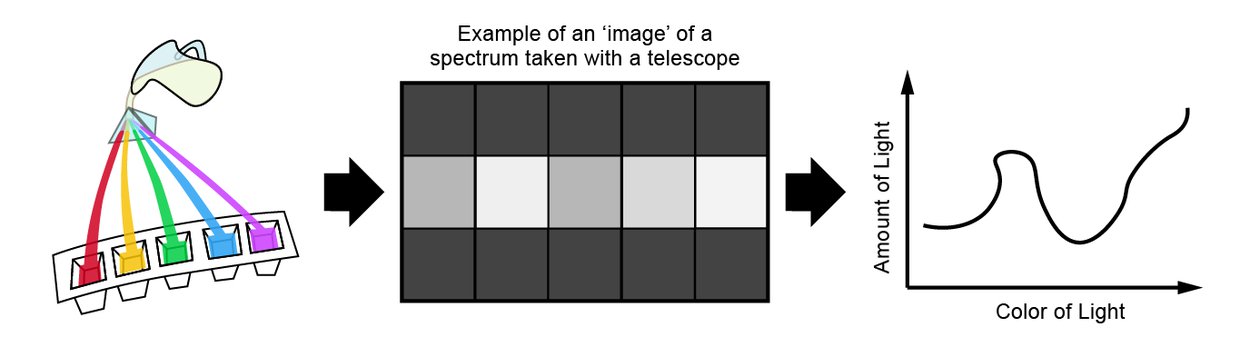
"The “image” we get back really just appears as a big black and white stripe, but that’s our infrared rainbow!"Image credit: Courtesy of Lustig-Yaeger, May, and Mayorga.
As data is collected, what does ‘work’ look like for astronomers day in and day out in the years to come?
In short, astronomers these days are data scientists that both analyze data from telescopes, and develop and run simulations of the astrophysical processes that take place in all the different corners of the universe. The majority of astronomers use the programming language Python for day-to-day work, particularly early-career scientists. For exoplanet astronomers, most of our tools are custom software packages designed specifically for exoplanet data analysis and modeling, sometimes even customized to the specific telescope we’re using or tailored to the type of exoplanet we’re studying.
As the telescope collects exoplanet data over the next few years, astronomers will proceed through many steps to translate the raw telescope data into new knowledge about exoplanets and the nature of their atmospheres. As previously mentioned, the data begin as a series of individual images of the infrared rainbow, each taken one after another as an exoplanet crosses in front of or behind its star. But the amount of light each bucket counts also comes with a lot of noise. Think of this like trying to take a selfie in the dark: the picture comes out a little grainy. That’s because it’s full of noise and very little light! Observational astronomers spend a lot of time trying to find all the sources of noise and coming up with clever ways to remove it using custom computer software tools. After we remove the noise from every infrared rainbow image, we can create what we call a “light curve,” a way to show how each color of light changes over time.
When we observe exoplanets, typically we’re looking for a dip in light when the planet crosses in front of the star, and this dip changes size depending on the color of light. When that planet crosses in front of the star, some stellar light passes through the planet’s atmosphere and interacts with the gasses and molecules that it’s made of. We can use information about the size of that dip to tell us what is in the planet’s atmosphere.
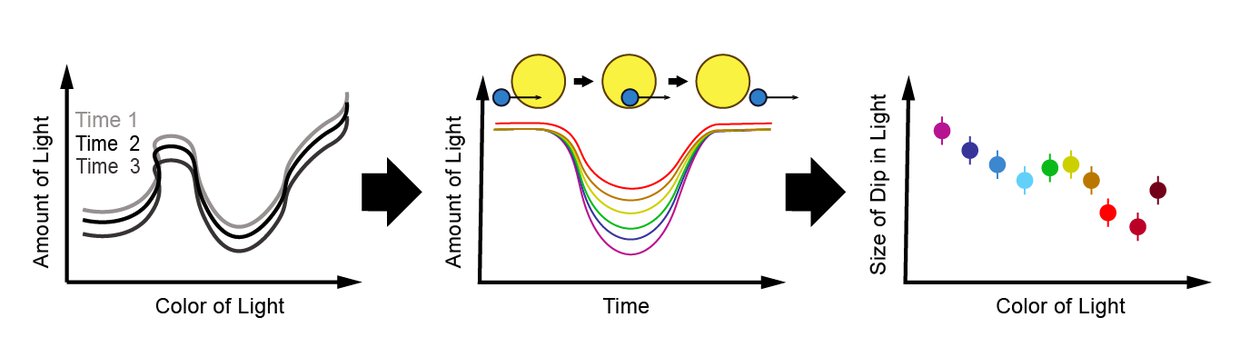
"When we observe exoplanets, typically we’re looking for a dip in light when the planet crosses in front of the star, and this dip changes size depending on the color of light."Image credit: Courtesy of Lustig-Yaeger, May, and Mayorga.
Next, astronomers analyze the exoplanet’s spectrum using computer models to understand how the unique characteristics of the exoplanet atmosphere gave rise to what the telescope observed. From decades of laboratory measurements here on Earth, we know precisely how individual molecules interact with light and that each molecule possesses its own unique spectral fingerprint. That is, every molecule interacts with light in a slightly different way, and this allows us to recognize them in our observations. Using these principles, astronomers run computer simulations of millions of different possible atmospheres that contain different mixtures of gasses to identify what cocktail of molecules offers the best agreement with the spectrum that the telescope measured.
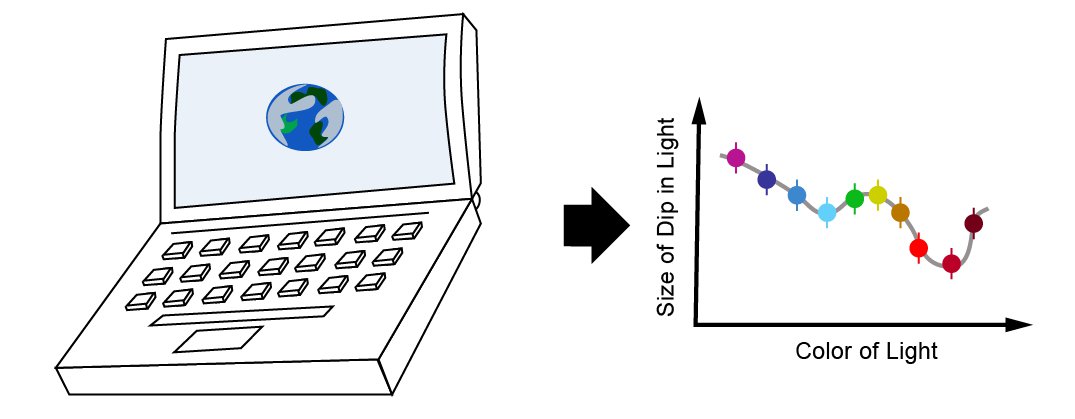
"Next, astronomers analyze the exoplanet’s spectrum using computer models to understand how the unique characteristics of the exoplanet atmosphere gave rise to what the telescope observed."Image credit: Courtesy of Lustig-Yaeger, May, and Mayorga.
Of course, after all of the analysis is complete, astronomers aren’t quite done. Like any good scientific venture, the final steps are to write up all of the findings into a manuscript that can be peer reviewed, published in an academic journal, and shared across the world.
About the Scientists:
 Jacob Lustig-Yaeger is a theoretical astrophysicist and astrobiologist at Johns Hopkins Applied Physics Lab. He uses computer models to simulate the observable signatures of rocky exoplanet atmospheres. Jacob co-leads an observing program to detect atmospheres on five rocky exoplanets, and eagerly anticipates the arrival of data and the foundational insights they will provide for the study of exoplanetary atmospheres.
 Erin May is an observational astrophysicist at Johns Hopkins Applied Physics Laboratory. She uses space- and ground- based telescopes to measure the amounts of different atoms and molecules in exoplanet atmospheres and to understand what their weather is like. She can’t possibly pick which data set she is most excited for, they’re all going to be absolutely amazing.
 Laura Mayorga is an astronomer at Johns Hopkins Applied Physics Laboratory. She studies the atmospheres and surfaces of Solar System objects to provide the ground truth for exoplanet observations with direct imaging capabilities. She also models the atmospheres of eccentric giant planets and looks forward to the data on HD 80606b.
References and Links:
(1) Astrobiology Graphic History, Issue 1: The Origin of a Science
Webb mission Page
First Images from the James Webb Space Telescope (NASA)