2011 Annual Science Report
 Arizona State University
Reporting | SEP 2010 – AUG 2011
Arizona State University
Reporting | SEP 2010 – AUG 2011
Habitability of Water-Rich Environments, Task 2: Model the Dynamics of Icy Mantles
Project Summary
Jupiter’s moon Europa provides a combination of physical and chemical conditions that may be among the most suitable in the solar system for sustaining life. Europa almost certainly has a liquid ocean. This ocean may have the ingredients necessary for life, but it is shielded from observation by a thick overlying ice layer. Under certain conditions this ice layer may undergo convection that can transport chemical species from the ocean to the surface, where they may be detected. Our computer modeling of convection in this ice layer aims to quantify how much ocean material may be brought to the surface. This work provides guidance for future missions to Europa.
Project Progress
Allen McNamara and PhD student Divya Allupeddinti have begun geophysical numerical simulations of mass transfer across the boundary between Europa’s surface ice and liquid water ocean. Student Allupeddinti is currently making excellent progress reproducing previous modeling results, to gain experience with numerical modeling. She will soon begin investigating the thermal evolution of icy satellites such as Europa. In particular, she will examine how ice shells grow and begin convection as the interior cools. McNamara is currently investigating the expected age distribution of ice within Europa’s ice shell. This will provide insights into whether trace elements entrained from the ocean layer can accumulate in shallower portions of the ice shell, and if they do, in what regions.
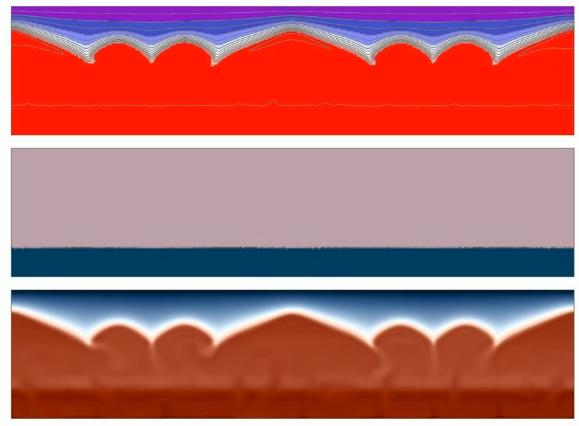
Numerical calculations of convection within Europa’s H2O layer. Figure X. Example of numerical calculations of convection within Europa’s H2O layer, which includes both solid ice and a low-viscosity fluid that represents water. The top panel is the logarithm of the viscosity field (purple represents highest viscosity and red represents lowest viscosity). Middle panel represents phase (lilac is ice and blue is liquid water). Bottom panel represents temperature field (redder is hotter and bluer is colder).
-
PROJECT INVESTIGATORS:
-
PROJECT MEMBERS:
Mikhail Zolotov
Co-Investigator
Ronald Greeley
Collaborator
Divya Allu Peddinti
Doctoral Student
-
RELATED OBJECTIVES:
Objective 1.1
Formation and evolution of habitable planets.
Objective 2.2
Outer Solar System exploration
