2009 Annual Science Report
 VPL at University of Washington
Reporting | JUL 2008 – AUG 2009
VPL at University of Washington
Reporting | JUL 2008 – AUG 2009
Earth as an Extrasolar Planet
Project Summary
Earth is the only known planet that can support life on its surface, and serves as our only example of what a habitable planet looks like. This task uses distant observations of the Earth taken from spacecraft combined with a sophisticated computer model of the Earth to understand the appearance and characteristics of a habitable planet. With our model, we can generate accurate simulations of the Earth’s brightness, color and spectrum, when viewed at different time-intervals, and from different vantage points. We are using these simulations to understand how we might detect signs of an ocean on a distant planet, and to understand the limitations of surface temperature measurements when a planet has significant cloud cover.
Project Progress
This year, we completed validation of the VPL Earth model against NASA EPOXI mission data of the distant Earth. The VPL Earth model is a 3-D, spatially-resolved, line-by-line, multiple-scattering spectroscopic model of the Earth. This model was previously validated against single observations of the Earth taken from spacecraft en route to other planets (Tinetti et al., 2006). The joint EPOXI NASA Discovery Mission of Opportunity (PIs Drake Deming: EPOCh and Mike A’Hearn: DIXI) reuses the Deep Impact spacecraft to observe the Earth as an extrasolar planet from distances in excess of 0.2 AU.
The model was rigorously challenged with several multi-wavelength, temporally resolved EPOXI datasets of the Earth observed continuously through three separate 24 hr periods. The resulting data-model comparison allowed us to significantly improve the model, which now includes an updated treatment of cloud spatial distribution and optical properties, and a Cox-Munk formalism for specular reflectance from the oceans. The validated model matches relative changes in brightness in the observed EPOXI lightcurves to better than 3%, and for multiple days of observation. The model also consistently matches the absolute brightness of the Earth to within 8%, which is well within the measurement error for the EPOXI data. This work was presented by doctoral student Ty Robinson at the 2008 DPS meeting, and is currently being prepared for publication.
We are now using the validated VPL Earth model to generate disk-averaged synthetic data of the Earth at different phases (fractional illumination), and at mid-infrared wavelengths. The phase-dependent views are being used to quantify the detectability of ocean glint in the disk-average, especially in the presence of realistic forward-scattering clouds, which could mask or mimic the ocean signal (Robinson et al., 2010, in prep) The MIR simulations are being used to quantify limitations in retrieval of planetary surface temperature from disk-averaged data in the presence of clouds (Meadows et al., 2010, in prep).
In addition we co-authored a publication on retrieval of planetary properties from the multi-wavelength time-dependent EPOXI whole-disk photometry of the Earth (Cowan et al., 2008). In this paper, principal component analysis was used to generate spatial maps based on color changes in the whole disk data, effectively retrieving spatial information about positions of the planet’s continents and oceans from disk-integrated data. We found that clouds do not significantly affect the retrieval of surface positions and properties and that the mapping algorithm was most sensitive to changes in the Earth’s disk-integrated color at longer wavelengths, due to the presence or absence of continents.
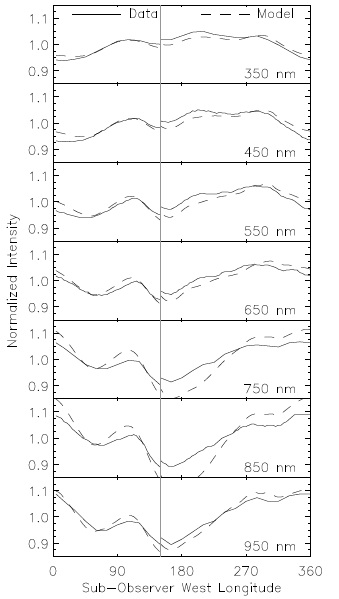
This figures compares simulated lightcurves of the Earth with Earth’s observed lightcurves in seven photometric bands spanning the visible taken on 18 March, 2009, with the EPOXI spacecraft. The data-model discrepancy is typically 3% or less across the full wavelength range.
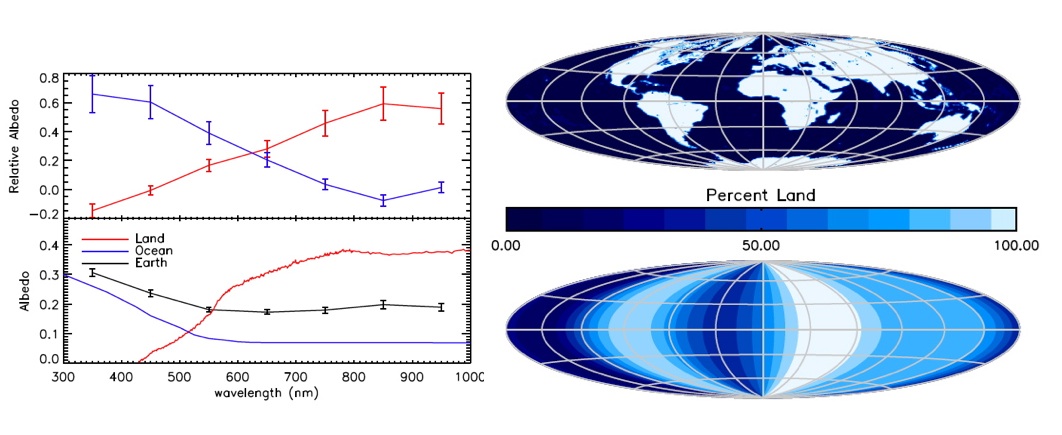
This figure shows the eigenspectra (left) and the resulting spatial maps (right) resulting from Principal Component Analysis (PCA) of multi-wavelength EPOXI lightcurves of the Earth. The two principal eigenspectra, a spectrum with enhanced red reflectivity, and a spectrum with enhanced blue reflectivity are shown in comparison with measured reflectivity spectra of the Earth’s land and oceans, obtained from the USGS spectral database. The resulting spatial map, which has longitudinal resolution but no latitudinal resolution is shown at bottom on the right, in comparison with a map of the Earth, above. Note that the PCA analysis correctly identifies the longitudinal position of continents and oceans, primarily through the red eigenspectrum, which is sensitive to the presence and absence of continents.
Publications
-
Cowan, N. B., Agol, E., Meadows, V. S., Robinson, T., Livengood, T. A., Deming, D., … Charbonneau, D. (2009). ALIEN MAPS OF AN OCEAN-BEARING WORLD. The Astrophysical Journal, 700(2), 915–923. doi:10.1088/0004-637x/700/2/915
- Hewagama, T., A’Hearn, M.F., Deming, D., Charbonneau, D., Lisse, C.M., Livengood, T.A., McFadden, L.A., Meadows, V.S., Seager, S., Wellnitz, D.D. & Team, E-E. (2009). The Astronomical Color of Earth from EPOXI Observations. Bulletin of the American Astronomical Society, 40: 404.
- Livengood, T.A., A’Hearn, M.F., Deming, D., Charbonneau, D., Hewagama, T., Lisse, C.M., McFadden, L.A., Meadows, V.S., Seager, S., Wellnitz, D.D. & Team, E-E. (2008). EPOXI Empirical Test of Optical Characterization of an Earth-like Planet. Bulletin of the American Astronomical Society, 40: 385.
- Robinson, T., Anderson, R. & Meadows, V.S. (2009). A Suite of Activities Developed for an Introductory Astrobiology Course for Non-Science Majors. Astrobiology, 9(5): 524.
- Robinson, T., Meadows, V.S., Deming, D., A’Hearn, M.F., Charbonneau, D., Hewagama, T., Lisse, C., Livengood, T., McFadden, L., Seager, S., Wellnitz, D.D. & Team, E.E. (2008). Simulating the Earth as an Extrasolar Planet. Bulletin of the American Astronomical Society, 40: 386.
-
PROJECT INVESTIGATORS:
-
PROJECT MEMBERS:
David Crisp
Co-Investigator
Jeffrey Pedelty
Collaborator
Nick Cowan
Postdoc
-
RELATED OBJECTIVES:
Objective 1.2
Indirect and direct astronomical observations of extrasolar habitable planets.
Objective 7.2
Biosignatures to be sought in nearby planetary systems

