2009 Annual Science Report
 University of Wisconsin
Reporting | JUL 2008 – AUG 2009
Co-Evolution of Microbial Metabolisms in the Neoarchean and Paleoproterozoic
Project Summary
The interplay between the biosphere, lithosphere, hydrosphere, and atmosphere has produced a complex evolution of microbial metabolisms that significantly affect the geochemical and mineralogical compositions of surface environments. One approach to tracing the evolution of very ancient microbial metabolisms is through studies of the isotopic compositions of elements that are cycled by life and preserved in the rock record. The Neoarchean and Paleoproterozoic (~3.1 to 2.4 billion years ago) record very large changes in C, S, and Fe isotope compositions in marine sedimentary rocks that are interpreted to reflect an explosion in microbial diversity, including establishment of oxygenic and anaerobic photosynthesis, aerobic methanotrophy, methanogenesis, and dissimilatory sulfate and iron reduction. The ecosystems on Earth in the Neoarchean and Paleoproterozoic juxtaposed oxidized and reduced environments, reflecting unique conditions during the time leading up to the first significant increase in atmospheric oxygen at ~2.4 b.y. ago.
Project Progress
Co-evolution of microbial metabolisms in the Neoarchean and Paleoproterozoic
The relative evolution of various microbial metabolisms has been classically constrained through phylogenetic reconstructions and estimates of the rate of evolution of molecules that are widely distributed and highly conserved – the “molecular clock” approach (e.g., Ochman and Wilson, 1987; Sheridan et al., 2003). Such approaches, however, have come under great scrutiny because of issues such as lateral gene transfer and uncertainties in estimating “rates” of molecular evolution. Another approach, one taken by the Wisconsin team, is tracing the distribution of metabolisms using the abundances and isotopic compositions and metabolically cycled elements in sedimentary rocks, such as C, S, and Fe.
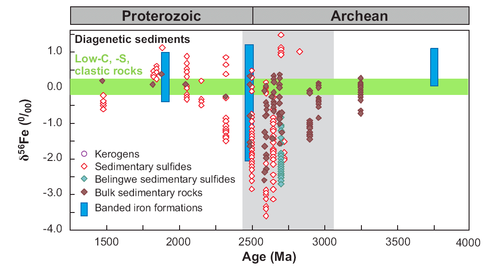
The largest excursions in kerogen C isotope compositions and mass-independent S isotope fractionations in sulfides occur between ~2.7 and 2.4 Ga (e.g., Farquhar and Wing 2003; Eigenbrode and Freeman 2006), suggesting major changes in the C and S cycles. It is now known that these changes are broadly accompanied by the largest Fe isotope excursion measured in the rock record (Fig. 1), but, prior to our work, C, S, and Fe isotopes have not been measured on the same sample. By combining multiple isotopes on the same samples, we are able to address the controversial interpretations of the Neoarchean and Paleoproterozoic Fe isotope record: one group interprets the Fe isotope compositions to directly reflect those of ancient seawater, produced by abiologic processes involving extensive precipitation of iron oxides (Rouxel et al. 2005; Anbar and Rouxel 2007), whereas another group favors microbial iron cycling, including dissimilatory Fe(III) reduction, where the isotopic compositions are unrelated to those of ancient seawater (Yamaguchi et al. 2005; Johnson et al. 2008a; Johnson et al. 2008b).
Figure 1. Temporal variations in Fe isotope compositions for marine sedimentary rocks of Archean and Proterozoic age. Green horizontal band marks range in δ56Fe values for several hundred analyses of low-C, -S clastic sedimentary rocks. Vertical gray band marks time of major negative excursion in δ13C values for kerogen. From Johnson et al. (2008b).
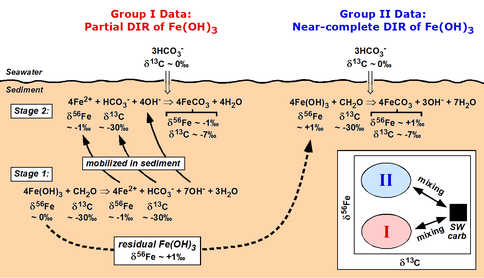
Our first completed study for this project during Year 2 involved C, O, and Fe isotope studies of Fe-rich carbonates (siderite; FeCO3) from 2.5 b.y.-old banded iron formations (BIF) from South Africa (SA); these are correlative with the famed Hamersley Basin BIFs of NW Australia, but the SA BIFs were subjected to lower grades of metamorphism. Studies of BIFs provide an important test of the proposal that the major Fe isotope excursion towards negative Fe isotope compositions (Fig. 1) in ~2.7 to 2.4 Ga age marine sedimentary rocks record a period when DIR was extensive, because isotopically fractionated Fe-rich rocks are difficult to produce by the abiological oxidation mechanism proposed by other workers. Periods of BIF deposition represent times when marine Fe fluxes were very high, including very high rates of Fe-rich sediment deposition, dramatically different than those of the modern marine iron cycle (Trendall 2002; Klein 2005) (Trendall et al. 2004). These results showed that none of the siderites in the BIFs had C, O, or Fe isotope compositions that would reflect precipitation from seawater, but instead are well modeled through production of FeCO3 through microbial reduction of Fe(III) oxides coupled to organic carbon oxidation (see equations in Fig. 2). Importantly, Fe isotope mass balance was demonstrated within the sample suite, where negative δ56Fe values are interpreted to reflect “light” aqueous Fe mobilized by DIR, and positive δ56Fe values seem likely to reflect the residue that remained after extraction of light Fe (Heimann et al., 2009), followed by reduction by DIR. This study provides strong evidence that DIR was a major metabolism involved during BIF formation in the Neoarchean, and does not support the abiological fractionation model of Rouxel et al. (2005) and Anbar and Rouxel (2007).
Figure 2. Schematic diagram illustrating the chemical reactions and C and Fe isotope fractionations produced by microbial dissimilatory iron reduction (DIR) during siderite (FeCO3) precipitation in banded iron formations (BIFs). Model is based on the observation that none of the C and Fe isotope compositions measured in BIF siderites reflect compositions appropriate for carbonate precipitated from seawater (“SW carb”; inset). From Heimann et al. (2009).
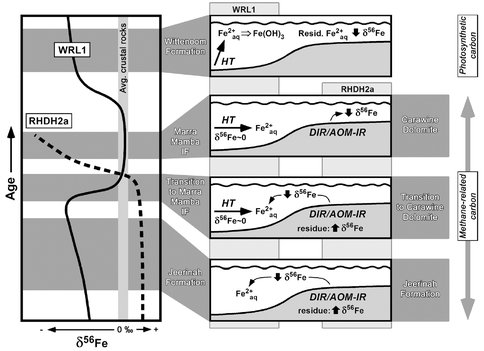
Our second completed study involved C, S, and Fe isotope studies of organic-rich black shales of the 2.7 to 2.5 b.y. Hamersley Basin, which records a period of time that precedes major BIF deposition discussed above and exactly coincides with the well known very large negative δ13C excursion for organic carbon (kerogen) in marine sedimentary rocks. Importantly, we compared the results from two cores that represented samples of the deep, central part of the basin, as well as the shallower basin margin. The results (Czaja et al., 2009) demonstrate that the different parts of the basin produced distinct isotopic trends, reflecting contrasts in depositional environments. These trends are difficult to explain by abiological processes, and, collectively, reflect the coupled C-S-Fe cycles that are expected by microbial metabolisms as related to basin geometry and timing relative to the anticipated increasing influence of photosynthesis (Figs. 3 and 4). For example, the negative δ56Fe values for Fe-rich shales of the Jeerinah Formation in the deep part of the basin are best explained by accumulation of low-δ56Fe Fe(II)aq that was produced by DIR on the basin margin; by mass-balance, moderately positive δ56Fe values are expected for the shallow parts of the basin, which reflect the residue from loss of light Fe to the center of the basin (Fig. 3). These relations are seen in the different cores, and are opposite to those that would be produced by abiological oxidation processes.
Figure 3. Schematic illustration of Fe isotope trends in the 2.7 to 2.5 Ga Hamersley Basin (Australia) for drill core from the center (“deep”) part of the basin (core WRL1) and the margin (“shallow”) of the basin (core RHDH2a), along with illustration of Fe mass transport interpretations from shelf to basin (right side of diagram). DIR: dissimilatory iron reduction; AOM-IR: anaerobic oxidation of methane coupled to microbial iron reduction; HT: hydrothermal Fe sources. Period of methane-related carbon cycling based on very low δ13C values for kerogen, and period of photosynthetic carbon cycling based on moderately negative δ13C values for kerogen, measured in the same samples (far right side of diagram).
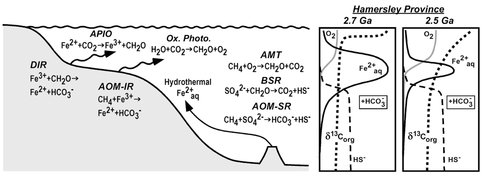
When variations in δ13C and δ34S are considered along with δ56Fe values, the picture that emerges is one of remarkable microbial diversity (Fig. 4). Processes that occurred in the photic zone included anaerobic photosynthesis coupled to Fe(II) oxidation, as well as oxygenic photosynthesis. Carbon isotope data, as well as molecular biomarkers measured on the same samples, provide support for aerobic methanotrophy (AMT) in shallow parts of the basin, indicating the presence of free O2. Microbial Fe reduction in the shallow shelf regions was coupled to oxidation of organic carbon (DIR) or anaerobic oxidation of methane (AOM-IR). Support for bacterial sulfate reduction (BSR) or anaerobic oxidation of methane coupled to sulfate reduction (AOM-SR) under conditions of limited sulfate contents comes from the generally positive δ34S values measured in the samples, where AOM-SR is ascribed to sediments that have highly negative δ13C values. The S isotope support for some, but limited, free O2 is consistent with conditions required to transport aqueous Fe within the basin. Overall, the large range in C, S, and Fe isotopes indicate large sections of the environments co-existed under reduced and oxidized conditions, with mass transfer occurring between these environments. We propose that such conditions were ideal for supporting a strong radiation of microbial metabolisms during this time on the early Earth.
Figure 4. Illustration of the range of microbial metabolisms identified in the 2.7-2.5 Ga Hamersley Basin (Australia) based on C, S, and Fe isotope variations. The data indicate that major changes in dissolved O2 contents, Fe2+aq, sulfide, and carbonate contents in the basin from 2.7 to 2.5 Ga (right side of figure). APIO: anaerobic photosynthetic iron oxidation; Ox. Photo.: oxygenic photosynthesis; DIR: dissimilatory iron reduction; AOM-IR: anaerobic oxidation of methane coupled to microbial iron reduction; AMT: aerobic methanotrophy; BSR: bacterial sulfate reduction; AOM-SR: anaerobic oxidation of methane coupled to bacterial sulfate reduction. From Czaja et al. (2009).
Publications
-
Czaja, A. D., Johnson, C. M., Beard, B. L., Eigenbrode, J. L., Freeman, K. H., & Yamaguchi, K. E. (2010). Iron and carbon isotope evidence for ecosystem and environmental diversity in the ∼2.7 to 2.5Ga Hamersley Province, Western Australia. Earth and Planetary Science Letters, 292(1-2), 170–180. doi:10.1016/j.epsl.2010.01.032
-
Heimann, A., Johnson, C. M., Beard, B. L., Valley, J. W., Roden, E. E., Spicuzza, M. J., & Beukes, N. J. (2010). Fe, C, and O isotope compositions of banded iron formation carbonates demonstrate a major role for dissimilatory iron reduction in ~2.5Ga marine environments. Earth and Planetary Science Letters, 294(1-2), 8–18. doi:10.1016/j.epsl.2010.02.015
-
Johnson, C. M., Beard, B. L., Klein, C., Beukes, N. J., & Roden, E. E. (2008). Iron isotopes constrain biologic and abiologic processes in banded iron formation genesis. Geochimica et Cosmochimica Acta, 72(1), 151–169. doi:10.1016/j.gca.2007.10.013
- Anbar, A.D. & Rouxel, O. (2007). Metal Stable Isotopes in Paleoceanography. Annual Review of Earth and Planetary Sciences, 35: 717-746.
- Eigenbrode, J.L. & Freeman, K.H. (2006). Late Archean rise of aerobic microbial ecosystems. Proc Natl Acad Sci U S A, 43: 15759-15764.
- Farquhar, J. & Wing, B.A. (2003). Multiple sulfur isotopes and the evolution of the atmosphere. Earth Planet Sci Lett, 213: 1-13.
- Johnson, C.M., Beard, B.L. & Roden, E.E. (2008). The iron isotope fingerprints of redox and biogeochemical cycling in the modern and ancient Earth. Ann Rev Earth Planet Sci, 36: 457-493.
- Klein, C. (2005). Some Precambrian banded iron-formations (BIFs) from around the world: Their age, geologic setting, mineralogy, metamorphism, geochemistry, and origin. Am Mineral, 90(10): 1473-1499.
- Ochman, H. & Wilson, A.C. (1987). Evolution in bacteria: Evidence for a universal substitution rate in cellular genomes. J. Mol. Evol, 26: 74–86.
- Rouxel, O.J., Bekker, A. & Edwards, K.J. (2005). Iron isotope constraints on the Archean and Paleoproterozoic ocean redox state. Science, 307(5712): 1088-1091.
- Sheridan, P.P., Freeman, K.H. & Brenchley, J.E. (2003). Estimated minimal divergence times of the major bacterial and archaeal phyla. Geomicrobiol. J, 20: 1-14.
- Trendall, A.F. (2002). The significance of iron-formation in the Precambrian stratigraphic record. In: Altermann, W. & Corcorane, P.L. (Eds.). Altermann W, Corcorane, P.L. Vol. 44. International Association of Sedimentologists Special Publication.
- Trendall, A.F., Compston, W., Nelson, D.R., De Laeter, J.R. & Bennett, V.C. (2004). SHRIMP zircon ages constraining the depositional chronology of the Hamersley Group, Western Australia. Aust Jour Earth Sci, 51(5): 621-644.
- Yamaguchi, K.E., Johnson, C.M., Beard, B.L. & Ohmoto, H. (2005). Biogeochemical cycling of iron in the Archean-Paleoproterozoic Earth: Constraints from iron isotope variations in sedimentary rocks from the Kaapvaal and Pilbara Cratons. Chem Geol, 218(1-2): 135-169.
-
PROJECT INVESTIGATORS:
-
PROJECT MEMBERS:
Brian Beard
Co-Investigator
Eric Roden
Co-Investigator
John Valley
Co-Investigator
Huifang Xu
Co-Investigator
Nicolas Beukes
Collaborator
Jennifer Eigenbrode
Collaborator
Katherine Freeman
Collaborator
Kosei Yamaguchi
Collaborator
Andrew Czaja
Postdoc
Philipp Heck
Postdoc
Adriana Heimann
Postdoc
Reinhard Kozdon
Postdoc
John Fournelle
Research Staff
Brian Hess
Research Staff
Jim Kern
Research Staff
Noriko Kita
Research Staff
Mike Spicuzza
Research Staff
Jason Huberty
Graduate Student
-
RELATED OBJECTIVES:
Objective 4.1
Earth's early biosphere.
Objective 5.1
Environment-dependent, molecular evolution in microorganisms
Objective 6.1
Effects of environmental changes on microbial ecosystems
Objective 7.1
Biosignatures to be sought in Solar System materials


