2015 Annual Science Report
 University of Illinois at Urbana-Champaign
Reporting | JAN 2015 – DEC 2015
University of Illinois at Urbana-Champaign
Reporting | JAN 2015 – DEC 2015
Project 11: Culturing Microbial Communities in Controlled Stress Micro-Environments
Project Summary
This project explores the adaptation and evolution of organisms under controlled environmental conditions, and compares the behavior across two Domains of Life in order to identify and quantify universal aspects of evolutionary response.
Project Progress
We have developed three different types of microfluidic gradient chambers or GeoBioCells (GBCs). Each GBC is an experimental test bed in which to quantitatively track, in live-time, microbial physiological and evolutionary stress response to micro-environmental gradients.
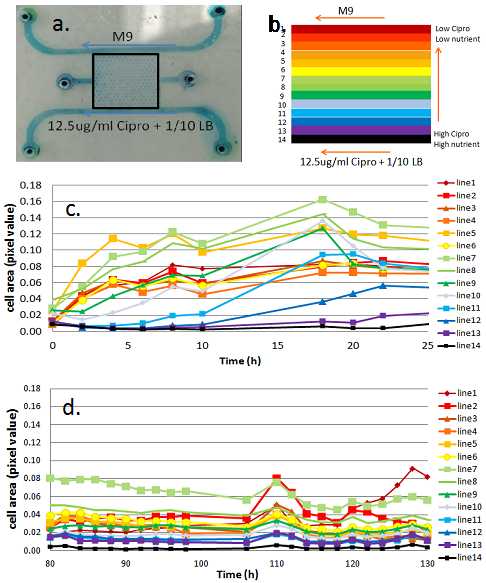
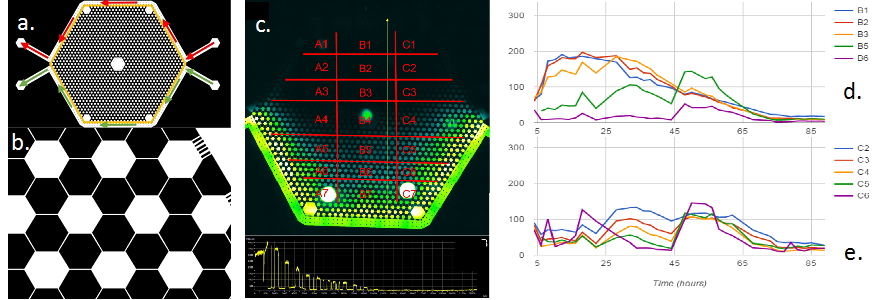
The first and second GBC test beds (i.e., GBC1 & GBC2) are polydimethylsiloxane (PDMS)-based microfluidic gradient chambers, each containing boundary flow-channels surrounding an array of more than 1,000 hexagonal interconnected wells. Hydrogel is selectively polymerized adjacent to the flow channels to create boundaries that allows solute diffusion, but are a barrier to microbial transport. LB media (20 mg/ml) plus Ciprofloxacin (12.5 ug/ml) are delivered through one boundary channel of each GBC test bed, while mineral media is delivered through the other boundary channel. The Ciprofloxacin (Cipro) is at 250x the minimum inhibitory concentration (MIC) for Escherichia coli 307; it inhibits DNA gyrase function by sitting in the active site of the enzyme and thus inhibits cell replication. E. coli are inoculated into the well-array field, and their growth and adaptation is monitored in the presence of the Cipro and LB gradient created by the GBC test beds. The two GBC test beds differ in their geometry, as illustrated in Figures 1a and 2a. GBC1 contains parallel boundary channels, while GBC2 contains boundary channels along a hexagonal well-array. These geometries result in constant and variable LB/Cipro gradients across the well-array, respectively.
Results from GBC1 and GBC2 are shown Figures 1 and 2. E. coli colonization spread across the entire Cipro gradient field within the porous media (Fig. 3) of both GBCs, indicating that E. coli rapidly adapts, and perhaps evolves dynamically to the micro-scale environment. In GBC1, most hexagonal wells near the center of the porous media have higher biomass than other areas, even higher than the zones farthest from the stressor source. In GBC2, biomass increases with distance from the Cipro gradient. Example of E. coli spatial distribution are shown in Figures 1c,d and 2d,e. The high growth zones in both GBCs represent the optimal ecological locations for survival, and are the target for measuring genetic mutations and other response changes. Cells were extracted from the GBC1 and grown on agar plates. Roughly 10% of the cells extracted were able to grow under 0.05 µg/ml (1x MIC) and even 0.1 µg/ml (2x MIC). Reasons for different results in the two GBCs are being explored, and molecular tools are being used to probe for gene mutations.
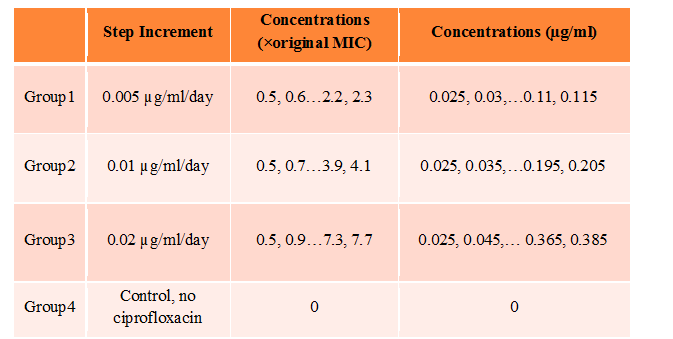
Batch culture experiments are in progress to determine the effects of time-stepped increments of Cipro on E. coli evolutionary adaptation. A single colony of E. coli was first inoculated into LB media, then 500 µl of the overnight culture was transferred into 4.5 ml of LB media containing 0.025 µg/ml Cipro. After incubation at 37C, the overnight culture was split into three groups, which were then subjected to different step-wise administrations of Cipro. Every 24 h, 500 µl culture of each group was transferred to 4.5 ml of LB media containing slightly higher Cipro concentrations. Optical density at 600 nm was measured for each group just before transferring to new media. The OD600 of each of the four groups versus Cipro concentrations are shown in Table 1. At the end of 18th increment, E. coli from group 1 (0.005 µg/ml/day increment) were growing on 0.35 µg/ml to 0.7 µg/ml (7X times the original MIC). E. coli from both group 2 (0.01 µg/ml/day increment) and group 3 (0.02 µg/ml/day increment) were growing on 0.7 µg/ml to 1.4 µg/ml (at least 14X the original MIC). Molecular tools are being used to probe for gene mutations.
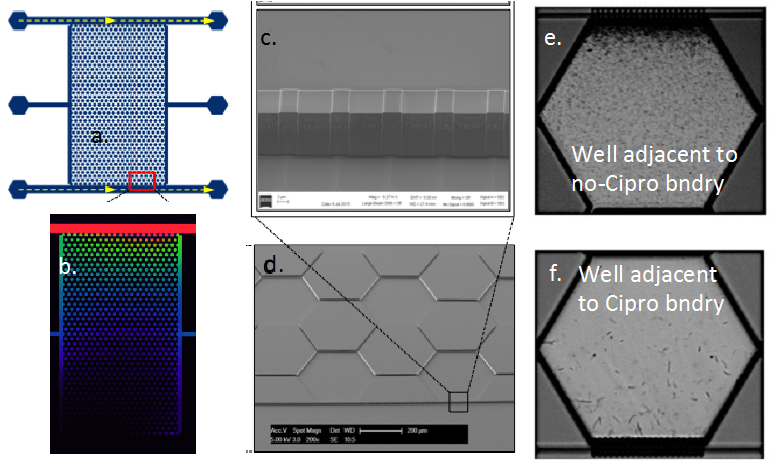
The third GBC (i.e., GBC3) has the same boundary channel and well-array geometry as GBC1, but is etched into silicon and sealed with a glass cover to allow evaluation of microbial adapation under anaerobic conditions. Also, instead of polymerizing hydrogel adjacent to the boundary channels, 200 nm silicon-etched slits bridge the boundary channel and well-array; these allow solute diffusion but prevent microbial passage. GBC3 is shown in Figure 3a, and a fluorophore gradient across the well-array is shown in Figure 3b. Shewanella oneidensis MR1 was inoculated into the well-array, and subject to a concentration gradient of Cipro at 4X and 10X the MIC. Time-lapse brightfield images of one experiment with S. oneidensis are shown in Figure 3e,f. Stressed cells adjacent to the boundary channel with Cipro initially undergo elongation. Over time, they appear to adapt as elongation decreases and cell activity increases. Effluent samples are being analyzed to determine if S. oneidensis in the gradient chamber are able to grow in batch at concentrations exceeding the MIC.
Publications
-
Alcalde, R. E., Zhou, L., Deng, J., Sanford, R. A., Fouke, B. W., & Werth, C. J. (2016). PHYSIOLOGICAL RESPONSE OF NITRATE REDUCING MICROORGANISMS TO STEEP ANTIBIOTIC CONCENTRATION GRADIENTS. []. doi:10.1130/abs/2016nc-275254
-
Boyd, V., Yoon, H., Zhang, C., Oostrom, M., Hess, N., Fouke, B., … Werth, C. J. (2014). Influence of Mg2+ on CaCO3 precipitation during subsurface reactive transport in a homogeneous silicon-etched pore network. Geochimica et Cosmochimica Acta, 135, 321–335. doi:10.1016/j.gca.2014.03.018
-
Dong, Y., Kumar, C. G., Chia, N., Kim, P-J., Miller, P. A., Price, N. D., … Fouke, B. W. (2013). H alomonas sulfidaeris -dominated microbial community inhabits a 1.8 km-deep subsurface Cambrian Sandstone reservoir. Environmental Microbiology, 16(6), 1695–1708. doi:10.1111/1462-2920.12325
-
Dong, Y., Sanford, R. A., Locke, R. A., Cann, I. K., Mackie, R. I., & Fouke, B. W. (2014). Fe-oxide grain coatings support bacterial Fe-reducing metabolisms in 1.7−2.0 km-deep subsurface quartz arenite sandstone reservoirs of the Illinois Basin (USA). Frontiers in Microbiology, 5. doi:10.3389/fmicb.2014.00511
-
Singh, R., Yoon, H., Sanford, R. A., Katz, L., Fouke, B. W., & Werth, C. J. (2015). Metabolism-Induced CaCO 3 Biomineralization During Reactive Transport in a Micromodel: Implications for Porosity Alteration. Environ. Sci. Technol., 49(20), 12094–12104. doi:10.1021/acs.est.5b00152
- Deng, J., R.A. Sanford, Y. Dong, L. Zhang, L. A. Schechtman, R. E. Alcalde, C.J. Werth, and B.W. Fouke, in preparation. Adaptation of Escherichia coli to Ciprofloxacin in a microfluidic pore network: the emergence of tolerance along a stress gradient, Applied and Environmental Microbiology.
- Dong, Y., Keating, K.M., Khetani, R.S., Fields, C., Inskeep, W.P., Sanford, R.A., Yau, P.M., Imai, B.S., Hernandez, A..G., Wright, C., Srivastava, V., Weber, J., Bulone, V., Cann, I.K.O., Guang, S., and Fouke, B.W. in revision. Survival Strategies of Low-Diversity Filamentous Microbial Mats within High-Temperature, Dysoxic and Turbulent Environments of Mammoth Hot Springs, Yellowstone National Park, USA. The ISME Journal
- Dong, Y., Sanford, R.A., Boyanov, M.I., Kemner, K.M., Flynn, T.M., O’Loughlin, E.J., Cann, I.K.O., Locke II, R.A., Weber, J.R., Egan, S.M., and Fouke, B.W. submitted. Fe-Reduction as a driver for subsurface microbial evolution. Environmental Microbiology
- Singh R., Fried G., Shivaguru M., Sanford R. A., Werth C. J., and Fouke, B. W. in preparation, The real rock GeoBioCell: microfluidic test bed to understand the evolution and ecology of the deep subsurface biosphere. J. Contaminant Hydrology
-
PROJECT INVESTIGATORS:
-
PROJECT MEMBERS:
Isaac Cann
Co-Investigator
Rod Mackie
Co-Investigator
Charles Werth
Co-Investigator
Reinaldo Alcalde
Collaborator
Jinzi Deng
Collaborator
Yiran Dong
Collaborator
Robert Sanford
Collaborator
Lang Zhou
Collaborator
-
RELATED OBJECTIVES:
Objective 6.1
Effects of environmental changes on microbial ecosystems
Objective 6.2
Adaptation and evolution of life beyond Earth
