2014 Annual Science Report
 VPL at University of Washington
Reporting | SEP 2013 – DEC 2014
VPL at University of Washington
Reporting | SEP 2013 – DEC 2014
Earth as an Extrasolar Planet
Project Summary
Earth will always be our best example of a habitable world. By studying Earth as a single point of light, which harkens back to the famous Pale Blue Dot image of our planet, we can develop ideas and techniques for characterizing other potentially habitable planets around distant stars. These techniques focus on remotely measuring or detecting fundamental planetary and atmospheric properties—-composition, total atmospheric mass, temperature, and the presence of a surface ocean.
Project Progress
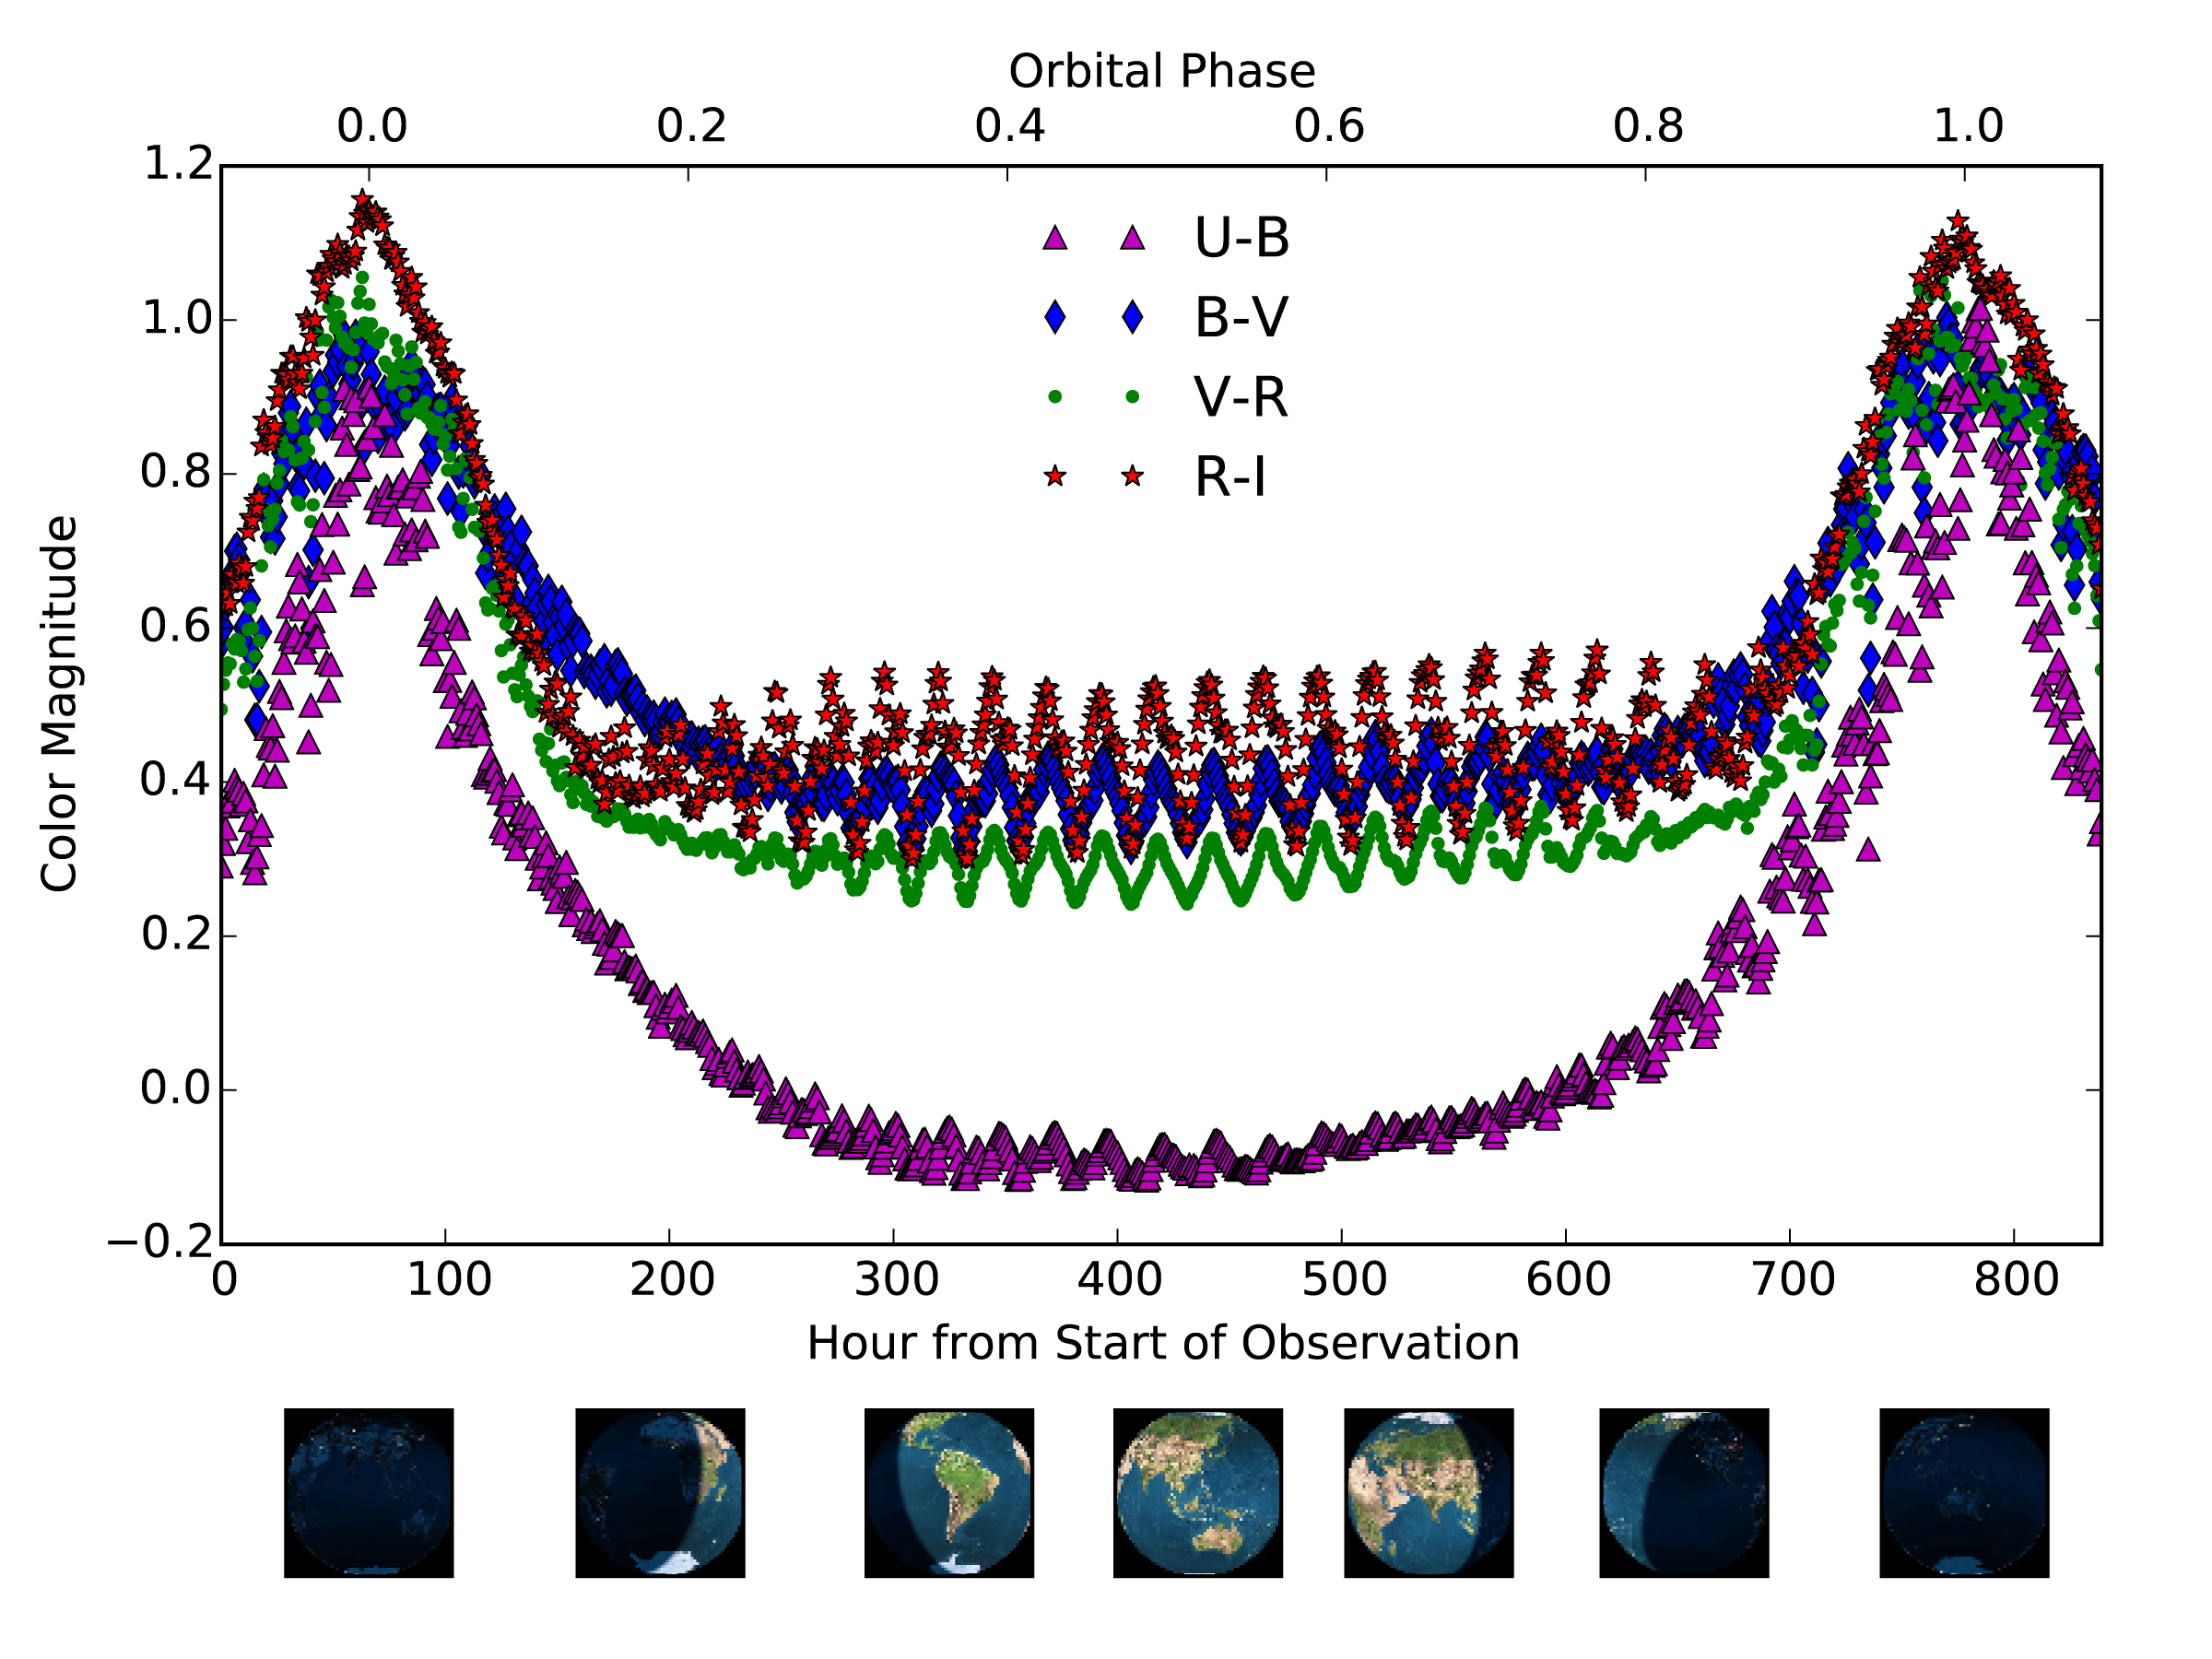
Virtual Planetary Laboratory team members have made substantial progress improving and validating the team’s 3-D spectral Earth model and in developing new ideas relevant to the characterizing of exo-Earths. In collaboration with the NLSI, team members Schwieterman, Robinson, Meadows and Sparks used the VPL 3-D, line-by-line, spectral Earth model to generate time-dependent spectra of the Earth from the far UV to the far infrared as it would be observed from the Moon over a one month span. These forward modeled spectra will provide an excellent reference dataset for testing the retrieval algorithms that may be employed for future spectral or photometric observations of terrestrial planets in the habitable zone. Broadband visible data show photometric color variation as a function of rotation and orbital phase (Figure 1).
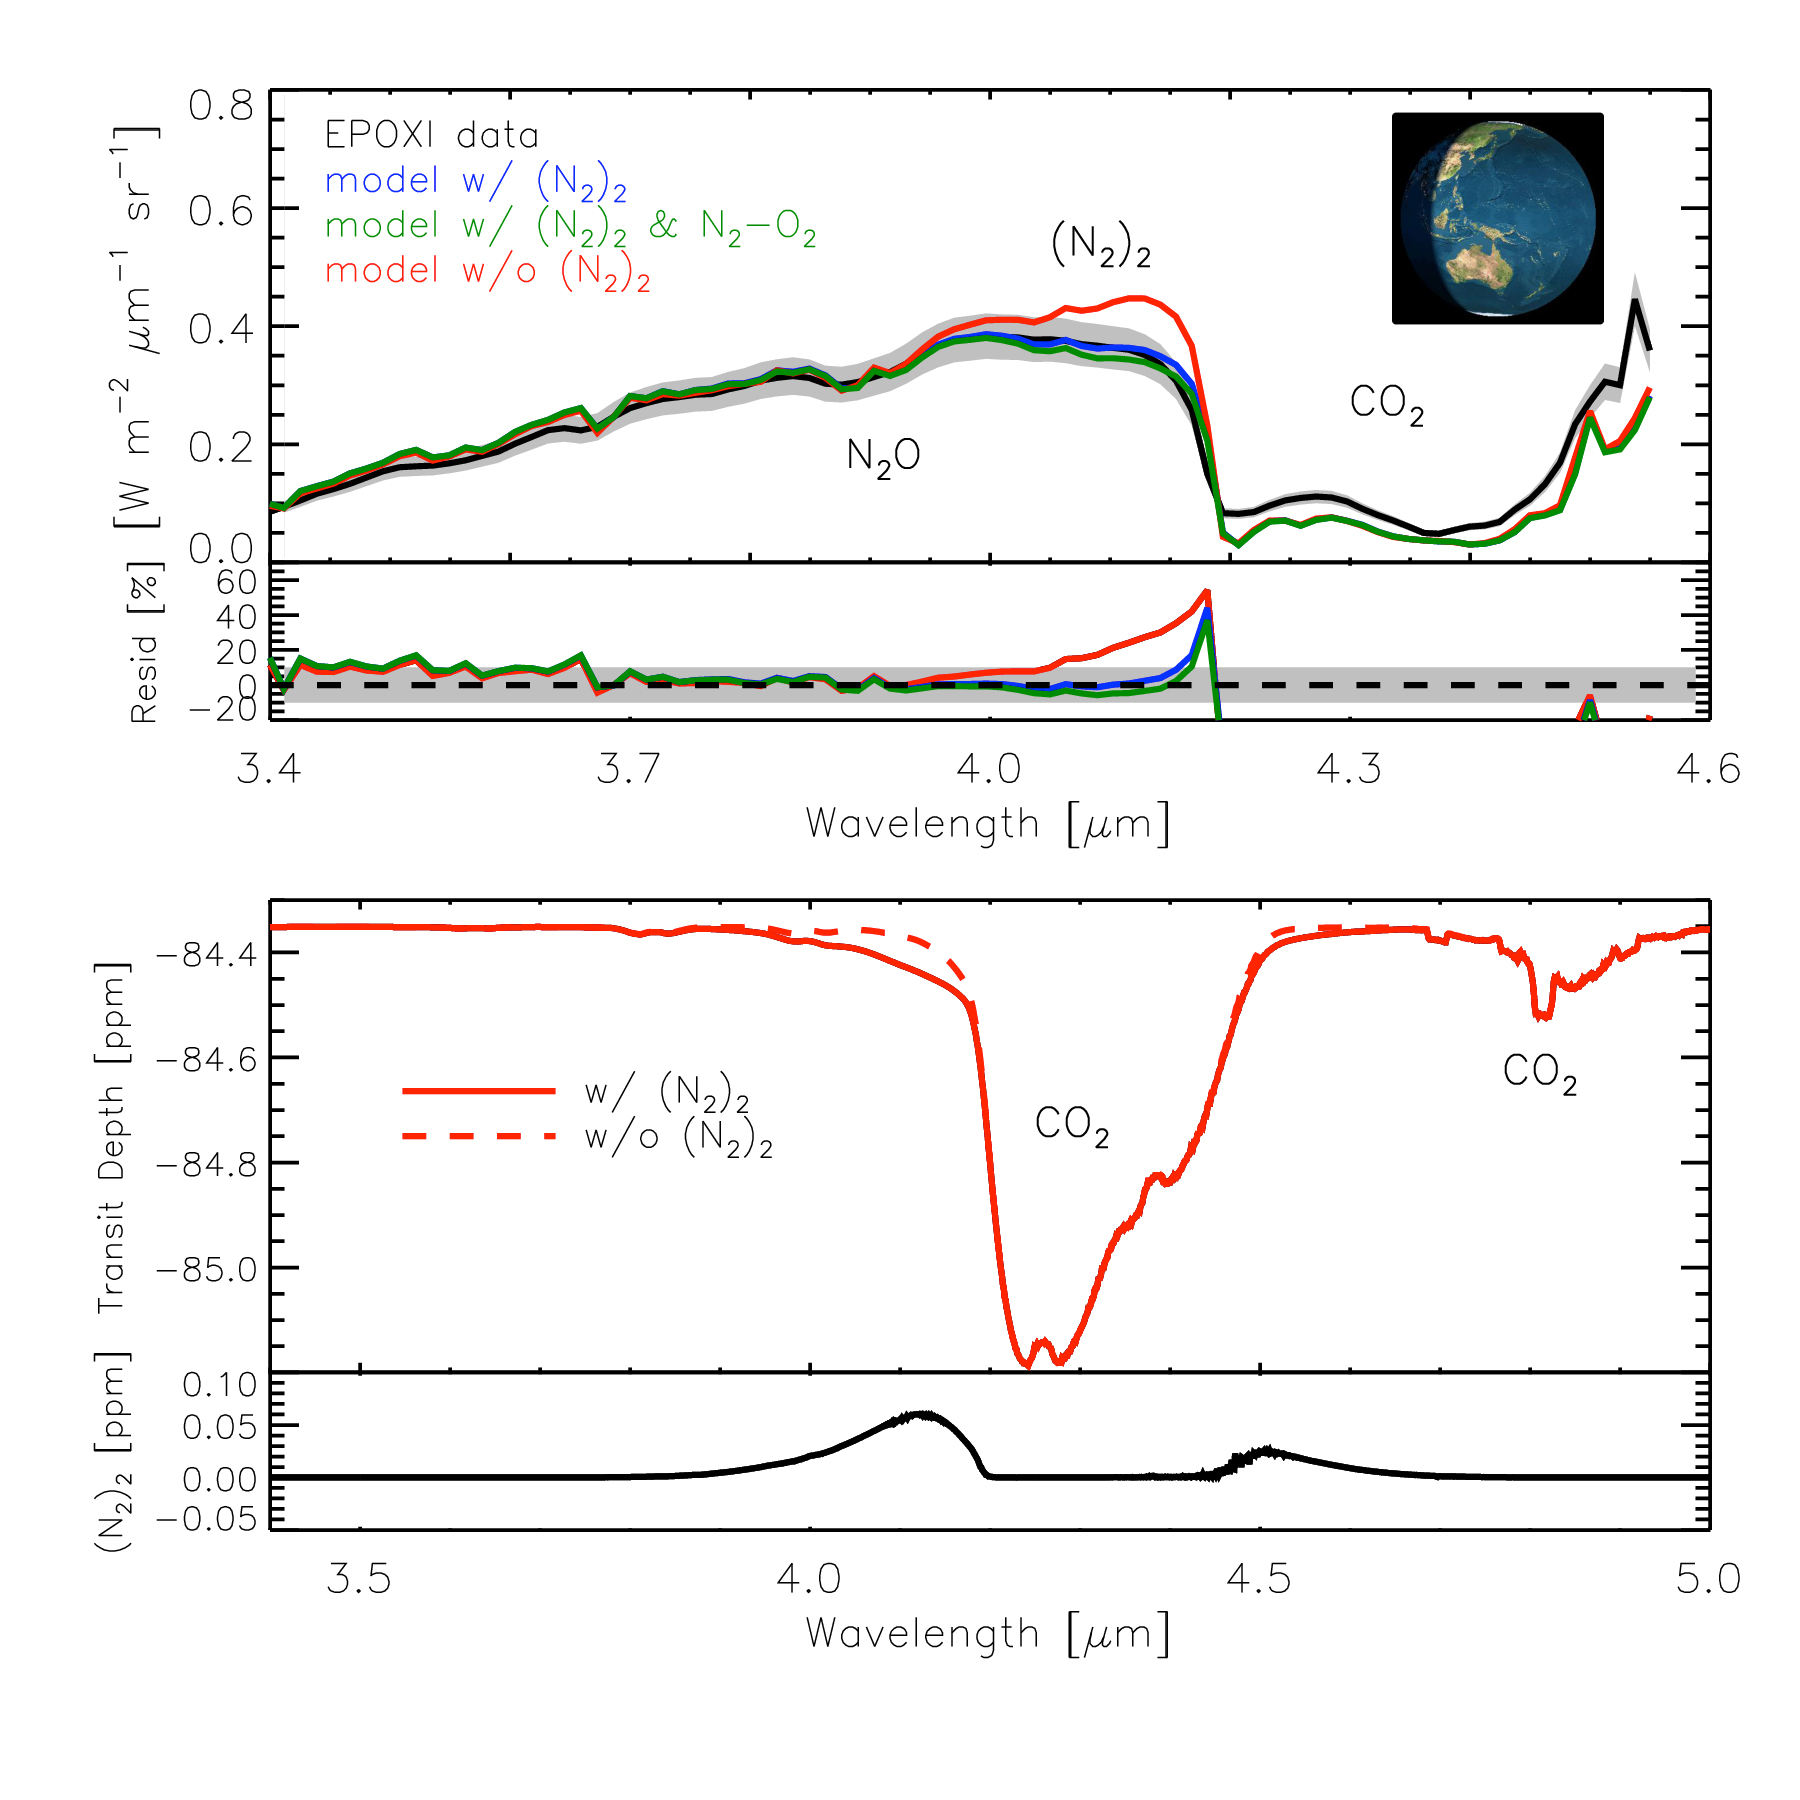
Using the VPL 3D spectral Earth model in conjunction with NIR spectral data of the Earth from NASA’s EPOXI mission, Schwieterman, Robinson, Meadows, Crisp and Misra have demonstrated, for the first time, that molecular nitrogen collision-induced absorption (CIA) in Earth’s disk-averaged spectrum is up to a 40% effect near 4 μm (Figure 2). We have used the calibration provided by the true Earth case to explore this absorption feature in other scenarios with model terrestrial planets of different surface pressures. By combining VPL tools for studying planetary climate, planetary spectra, and exoplanet transmission spectra, we are working to understand how the detection of nitrogen CIA could help constrain the surface pressure on an exoplanet (Schwieterman et al., in prep).
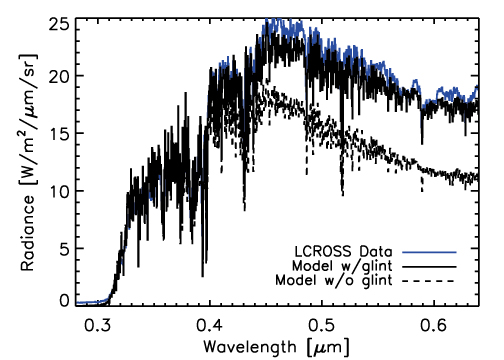
Finally, in collaboration with NLSI and members of NASA’s LCROSS mission team, Robinson, Meadows, Sparks and Schwieterman used the team’s 3-D spectral Earth model to characterize LCROSS observations of the Pale Blue Dot (Robinson et al., 2014). Part of this calibration included a substantial recalibration of the LCROSS visible spectrometer data, thereby benefiting NASA lunar science. The LCROSS Earth observations were used to show the significance of ozone biosignatures. These Earth data were also used as wavelength-dependent, observational confirmation of VPL predictions for the significance of ocean glint in crescent phase, disk-averaged observations of Earth (Figure 3). These results indicate that ocean glint is likely to be one of the best observable markers of habitability, and may require only phase-dependent photometry to observe.
Publications
-
Robinson, T. D., Ennico, K., Meadows, V. S., Sparks, W., Bussey, D. B. J., Schwieterman, E. W., & Breiner, J. (2014). DETECTION OF OCEAN GLINT AND OZONE ABSORPTION USING LCROSS EARTH OBSERVATIONS. The Astrophysical Journal, 787(2), 171. doi:10.1088/0004-637x/787/2/171
-
PROJECT INVESTIGATORS:
-
PROJECT MEMBERS:
David Crisp
Co-Investigator
Amit Misra
Co-Investigator
Edward Schwieterman
Co-Investigator
William Sparks
Co-Investigator
-
RELATED OBJECTIVES:
Objective 1.2
Indirect and direct astronomical observations of extrasolar habitable planets.
Objective 7.2
Biosignatures to be sought in nearby planetary systems

