2011 Annual Science Report
 VPL at University of Washington
Reporting | SEP 2010 – AUG 2011
VPL at University of Washington
Reporting | SEP 2010 – AUG 2011
Earth as an Extrasolar Planet
Project Summary
Earth is the only known planet that can support life on its surface, and serves as our only example of what a habitable planet looks like. This task uses distant observations of the Earth taken from spacecraft combined with a sophisticated computer model of the Earth to understand the appearance and characteristics of a habitable planet. With our model, we can generate accurate simulations of the Earth’s brightness, color and spectrum, when viewed at different time-intervals, and from different vantage points. This year we used these simulations to understand how we might detect the presence of an ocean on an exoplanet using polarization, and the presence of a moon around a distant exoplanet using heat energy, rather than visible light.
Project Progress
Significant progress has been made over the reporting period in our “Earth as an Extrasolar Planet” project, including the near-completion of the “Earth through a Year” task, and the development of an additional polarization capable model.
In Robinson et al. (2011), we described and validated the Virtual Planetary Laboratory’s 3-D spectral Earth model, which is a community tool that simulates the appearance of Earth to a distant observer. The model uses a variety of data from a number of Earthobserving satellites as input, and outputs spatially- and spectrally-resolved images and diskintegratedspectra of Earth. By comparing the model to observations from both NASA’s EPOXI mission and the Atmospheric Infrared Sounder (aboard NASA’s Aqua satellite), we have successfully validated the model at wavelengths from the ultraviolet to the thermal infrared.
A number of applications of the VPL Earth model have already been realized. In Robinson et al. (2010), we used the model to simulate Earth’s appearance in reflected light over a year, including the realistic evolution of cloud, snow, and sea ice cover. The purpose of the paper was to investigate the significance of “glint”, the mirror-like reflection of sunlight off a body of water, in the presence of realistic forward scattering clouds, in Earth’s phasedependent brightness. We found that the crescent-phase Earth is as much as 100% brighter than an identical non-glinting Earth at some near-infrared wavelengths. Such an excess in brightness may be detectable by NASA’s James Webb Space Telescope if it were to fly with an external occulter.
We also completed and submitted work on the detectability of a moon around an exoplanet as a function of wavelength and observed phase, i.e. whether the exoEarth and moon are observed at full, or near crescent phase (Robinson, et al., 2011). The Earth model was used in conjunction with a model of the Moon to show that the contribution of the exomoon to the exoEarth spectrum is very strongly phase dependent, and more likely to be detectable in the exoEarth’s carbon dioxide absorption bands. In a separate project, we modified our line-by-line radiative transfer model to simulate transmission spectroscopy. This work was validated against ATMOS-1 observations of the Earth’s transmission, and is currently being used to determine sensitivity to atmospheric pressure (Misra et al., 2011).
We also looked at the detectability of an ocean in polarized light. We developed a model of polarized and total light scattering from planetary atmospheres and surfaces (Zugger et al., NAI Information 2010) which we used to study the variation and brightness of various hypothetical exoplanets. Early, simplified models had shown that a large ocean on such a planet could be identified by unique brightness and polarization peaks in the orbital light curves. However, our more comprehensive model, which includes atmospheric Rayleigh and aerosol scattering, ocean waves, scattering from within the water column, clouds, and other factors, showed that attempted identification of an ocean in this more realistic scattering environment would be problematical, providing both false positives (dry planets mistaken for ocean planets) and false negatives (obscured ocean surfaces). However, it is possible that some nearby ocean planets, if they exist, could be identified using this method, and polarization could also be used to help determine planet association with the star, and constrain orbit inclination.
In the Zugger et al., (2011) paper, we expanded the model into the near-infrared, and investigated the possibility that ocean planets could be identified using variations in the brightness and polarization of near-IR orbital light curves. We confirmed that obscuration due to Rayleigh scattering becomes insignificant in the near infrared, but other obscuring factors are undiminished. In particular, aerosol scattering in a marine atmosphere dominates in the absence of Rayleigh scattering, and even a moderate fraction of Earth-like clouds can hide the polarized and unpolarized glint signature of an ocean. Observing in the near infrared increases the difference in brightness between an ocean planet and a desert planet, provided the ocean and desert planets have Earth-like atmospheric aerosols typical of those environments.
We have also initiated a collaboration with the “Haystack” project, lead by Dr. Maggie Turnbull. This project combines realistic modeling of the astronomical sky provided by Large Scale Synoptic Telescope (LSST) scientists here at UW, with models of exozodiacal light from planetary systems provided by Aki Roberge at GSFC, and then embeds predicted photometry, spectra and even time-dependent and phase-dependent lightcurves of the Earth into this data, as a testbed product for future terrestrial exoplanet mission Design Reference Mission studies.
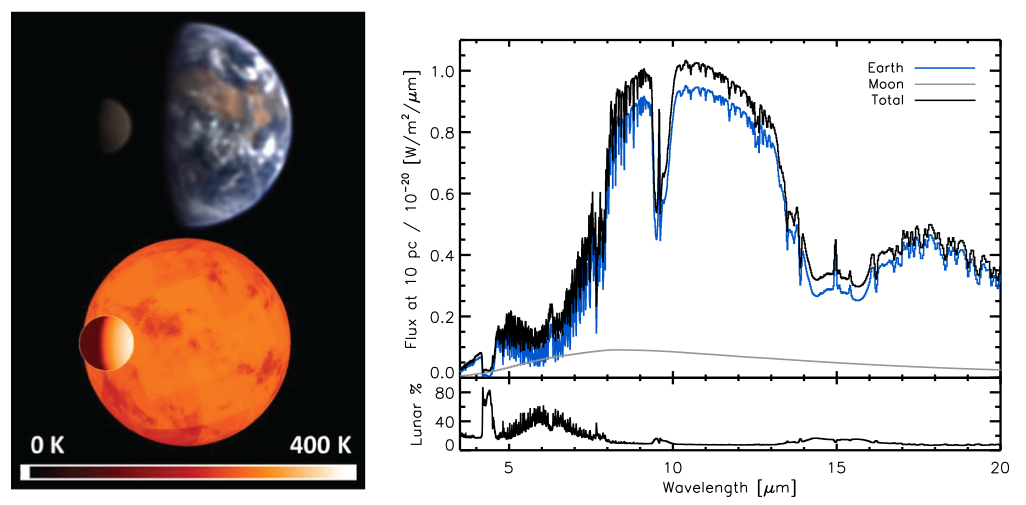
Fig. 1.— True color image of the Earth-Moon system, taken as part of NASA’s EPOXI mission compared to a simulated image using 10 _m brightness temperatures from our models. The spectra on the right shows the corresponding flux at 10 pc from the Moon (grey), Earth (blue), and the combined Earth-Moon flux (black), not including transit effects. The panel below the spectra shows the wavelength dependent lunar fraction of the total signal. Images and spectra are for a phase angle of 75.1◦
Publications
-
Cowan, N. B., Robinson, T., Livengood, T. A., Deming, D., Agol, E., A’Hearn, M. F., … Wellnitz, D. D. (2011). ROTATIONAL VARIABILITY OF EARTH’S POLAR REGIONS: IMPLICATIONS FOR DETECTING SNOWBALL PLANETS. The Astrophysical Journal, 731(1), 76. doi:10.1088/0004-637x/731/1/76
-
Crow, C. A., McFadden, L. A., Robinson, T., Meadows, V. S., Livengood, T. A., Hewagama, T., … Wellnitz, D. (2011). VIEWS FROM EPOXI : COLORS IN OUR SOLAR SYSTEM AS AN ANALOG FOR EXTRASOLAR PLANETS. The Astrophysical Journal, 729(2), 130. doi:10.1088/0004-637x/729/2/130
-
Robinson, T. D. (2011). MODELING THE INFRARED SPECTRUM OF THE EARTH-MOON SYSTEM: IMPLICATIONS FOR THE DETECTION AND CHARACTERIZATION OF EARTHLIKE EXTRASOLAR PLANETS AND THEIR MOONLIKE COMPANIONS. The Astrophysical Journal, 741(1), 51. doi:10.1088/0004-637x/741/1/51
-
Robinson, T. D., Meadows, V. S., & Crisp, D. (2010). DETECTING OCEANS ON EXTRASOLAR PLANETS USING THE GLINT EFFECT. The Astrophysical Journal, 721(1), L67–L71. doi:10.1088/2041-8205/721/1/l67
-
Robinson, T. D., Meadows, V. S., Crisp, D., Deming, D., A’Hearn, M. F., Charbonneau, D., … Wellnitz, D. D. (2011). Earth as an Extrasolar Planet: Earth Model Validation Using EPOXI Earth Observations. Astrobiology, 11(5), 393–408. doi:10.1089/ast.2011.0642
-
Zugger, M. E., Kasting, J. F., Williams, D. M., Kane, T. J., & Philbrick, C. R. (2010). LIGHT SCATTERING FROM EXOPLANET OCEANS AND ATMOSPHERES. The Astrophysical Journal, 723(2), 1168–1179. doi:10.1088/0004-637x/723/2/1168
-
Zugger, M. E., Kasting, J. F., Williams, D. M., Kane, T. J., & Philbrick, C. R. (2011). SEARCHING FOR WATER EARTHS IN THE NEAR-INFRARED. The Astrophysical Journal, 739(1), 12. doi:10.1088/0004-637x/739/1/12
-
Zugger, M. E., Kasting, J. F., Williams, D. M., Kane, T. J., & Russell Philbrick, C. (2011). ERRATUM: “LIGHT SCATTERING FROM EXOPLANET OCEANS AND ATMOSPHERES” (2010, ApJ, 723, 1168). The Astrophysical Journal, 739(1), 55. doi:10.1088/0004-637x/739/1/55
- Robinson, T.D., Meadows, V. & Crisp, D. (2010). Earth as an Extrasolar Planet. Bulletin of the American Astronomical Society.
- Zugger, M., Kasting, J.F., Williams, D.M., Kane, T.J. & Philbrick, C.R. (2011). Light Scattering from Exoplanet Oceans and Atmospheres. Bulletin of the American Astronomical Society.
-
PROJECT INVESTIGATORS:
-
PROJECT MEMBERS:
David Crisp
Co-Investigator
James Kasting
Co-Investigator
Nick Cowan
Collaborator
Aomawa Shields
Graduate Student
Nicole Evans
Undergraduate Student
-
RELATED OBJECTIVES:
Objective 1.2
Indirect and direct astronomical observations of extrasolar habitable planets.
Objective 7.2
Biosignatures to be sought in nearby planetary systems

