2011 Annual Science Report
 University of Wisconsin
Reporting | SEP 2010 – AUG 2011
University of Wisconsin
Reporting | SEP 2010 – AUG 2011
Project 3A: Stable Isotope and Mineralogical Studies of Banded Iron Formations - O and Si Isotopes by SIMS
Project Summary
We have studied the mineralogy and microscopic textures of four banded iron formations (BIFs): Isua, Greenland (3.8 Ga); Hamersley, Western Australia (2.5 Ga); Transvaal, South Africa (2.5 Ga), and Biwabik, Minnesota, USA (1.9 Ga). These rocks have been interpreted to preserve records of conditions and chemistry of Precambrian oceans. This hypothesis is evaluated with in situ SIMS analysis of oxygen (δ18O) and silicon isotope ratios (δ30Si) in chert domains within the BIFs. The paragenesis of magnetite and hematite is important to understanding the fluid and thermal history of unmetamorphosed or low-temperature (sub-greenschist facies) oxide-facies BIFs. We identified silician (up to 3 wt% SiO2) magnetite overgrowths in samples of the Dales Gorge BIF from Wittenoom. We hypothesize that silician magnetite is stabilized by organic matter and thus is a biosignature. We investigated the distribution of δ18O values in quartz, magnetite, silician magnetite, and hematite by SIMS and found that while quartz is homogeneous (average δ18O = 22.0 ±1.3‰ 2SD, VSMOW), values of δ18O for magnetite and hematite vary by 13‰ (-5 to +7‰) and are correlated with different generations of magnetite and hematite.
Project Progress
We have studied the mineralogy and microscopic textures of four banded iron formations (BIFs): Isua, Greenland (3.8 Ga); Hamersley, Western Australia (2.5 Ga); Transvaal, South Africa (2.5 Ga), and Biwabik, Minnesota, USA (1.9 Ga). These rocks have been interpreted to preserve records of conditions and chemistry of Precambrian oceans. This hypothesis is evaluated with in situ SIMS analysis of oxygen (δ18O) and silicon isotope ratios (δ30Si) in chert domains within the BIFs. The paragenesis of magnetite and hematite is important to understanding the fluid and thermal history of unmetamorphosed or low-temperature (sub-greenschist facies) oxide-facies BIFs. We identified silician (up to 3 wt% SiO2) magnetite overgrowths in samples of the Dales Gorge BIF from Wittenoom. We hypothesize that silician magnetite is stabilized by organic matter and thus is a biosignature. We investigated the distribution of δ18O values in quartz, magnetite, silician magnetite, and hematite by SIMS and found that while quartz is homogeneous (average δ18O = 22.0 ±1.3‰ 2SD, VSMOW), values of δ18O for magnetite and hematite vary by 13‰ (-5 to +7‰) and are correlated with different generations of magnetite and hematite.
Correlated δ18O and δ30Si analyses in BIF quartz show that while δ18O values are affected by metamorphism, δ30Si values display a similar range of 2-3‰ for all BIFs studied regardless of metamorphic grade or age. Thus δ30Si values are relatively insensitive to metamorphism and may retain primary depositional values. The δ30Si values are homogeneous to ±0.6‰ within individual sub-mm microlaminae, and during metamorphism exchange of Si is restricted to the sub-mm scale (Fig. 1). Further, high δ30Si values of up to +1.3‰ for Isua BIF suggest that continental weathering was locally important as early as 3.8 Ga.
Variation in δ18O values between quartz and magnetite are commonly used to assess equilibrium isotope fractionation in banded iron formations. Previous reports found that the δ18O values of quartz from the Dales Gorge BIF were either homogeneous at 22.0 ±1.3‰ (2SD, VSMOW, Becker and Clayton 1976, bulk analysis) while a more recent study found the δ18O values for quartz varied by 13‰ (11 to 24‰, Hayashi et al. 2008 and Ohmoto 2006, laser probe). In our study, the δ18O analyses of magnetite, silician magnetite, and hematite are precise to ±1‰ (2SD) employing modified SIMS analytical conditions developed to minimize variability in measured δ18O analyses due to crystal orientation effects (Kita et al., 2010; Huberty et al., 2010b). We determine a paragenetic sequence for iron oxides based on their δ18O values by SIMS and textural characteristics: magnetite sub-microlaminae, recrystallized magnetite fragments, silician magnetite overgrowths, euhedral low-Si magnetite euhedra, and anhedral hematite laminae (Huberty et al., 2010c). Figure 2 shows a plot of δ18O(magnetite) vs. δ18O(quartz) for BIFs worldwide. The δ18O zoning in magnetite microlaminae from the Dales Gorge Member reflects primary depositional values while δ18O values for quartz were homogenized during diagenesis and low temperature metamorphism (<300°C).
We used the UW-Madison CAMECA ims-1280 ion microprobe to develop a silicon isotope standard for quartz. The spot-to-spot precision in δ30Si is ±0.2‰ (2SD, n = 14) for our quartz standard UWQ-1, which is more homogeneous than grains of NBS-28 quartz (±0.3, 2SD, n = 26).
In samples of quartz from the four BIFs, values of δ30Si show a range of ~5‰, from -3.7‰ to +1.2‰ and extend to the lowest values reported for the Precambrian. The average δ30Si for Isua is -1.6‰ while for Hamersley, Transvaal, and Biwabik, the average δ30Si value is identical and 1‰ higher at -0.6‰ (Heck et al., 2011). The range in δ30Si values is 4.5‰ for Isua, 3.5‰ for Hamersley, 2.7‰ for Biwabik, and 2.6‰ for Transvaal. Values of δ18O range from +7.9‰ to +31.4‰, including the highest reported δ18O values in BIF quartz (Huberty et al., 2010c; Heck et al., 2011). We interpret the narrow range in δ18O for Transvaal and Hamersley BIFs to reflect homogenization of quartz, thus these samples are not in equilibrium with seawater and cannot be used for oxygen isotope thermometry.
Individual amphibolite-facies samples from Isua are homogeneous in δ18O at the cm-scale, but show similar variability in δ30Si as BIFs that have not experienced high temperature metamorphism. The wide range of δ30Si at Isua suggests that silicon isotopes are not homogenized at the cm-scale by amphibolite facies metamorphism, as is observed for δ18O values. Most of our δ30Si values fall below the mantle value of -0.4‰ and agree with the range of hydrothermal silica (δ30Si = -0.4 to -3.0‰), while δ30Si values greater than -0.4‰ may suggest a continental source. Thus our data show a mixture of both sources for Si in BIF quartz.
We have studied in detail the mineralogy of magnetite from the Dales Gorge Member of the Brockman Iron Formation, Hamersley Group, Western Australia. Figure 3 shows a BSE-SEM image where contrast has been adjusted to show only magnetite (Huberty et al., 2010a, 2011). Quartz, carbonate, and stilpnomelane are present but appear black in this image. Internal magnetite sub-microlaminae (white/ light grey) contain numerous μm to sub-μm inclusions of quartz, carbonate, apatite, and stilpnomelane whereas silician magnetite overgrowths (darker grey) are devoid of mineral inclusions. In situ micro-X-ray diffraction shows that the lattice parameter for silician magnetite is 8.388(2) to 8.392(2) Å (Huberty et al., 2011), lower than the reference value for pure magnetite, 8.397 Å, indicating that silicon is present in magnetite as solid solution. Similarly, high resolution bright field TEM images and select area diffraction patterns confirm the absence of quartz micro-inclusions and that silicon is in solid solution in magnetite. Silician magnetite is the dominant Fe-oxide in the Dales Gorge BIF. We hypothesize that the former presence of organic matter may be required to attain the low oxygen fugacity necessary to stabilize silicon in magnetite and propose that silician magnetite is a biosignature.
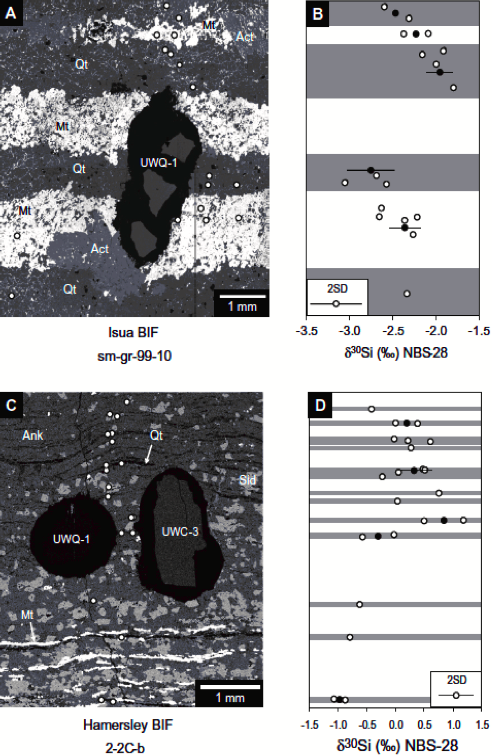
Figure 1. A, C. BSE images of samples from the Isua and Hamersley BIFs with embedded UW standards. B, D. Values δ30Si values (white dots) are homogeneous to ±0.6‰ within individual sub-mm microlaminae, but average δ30Si values are variable between successive microlaminae, outside of uncertainty for multiple analyses within single laminae, suggesting that during metamorphism exchange is restricted to the sub-mm scale.
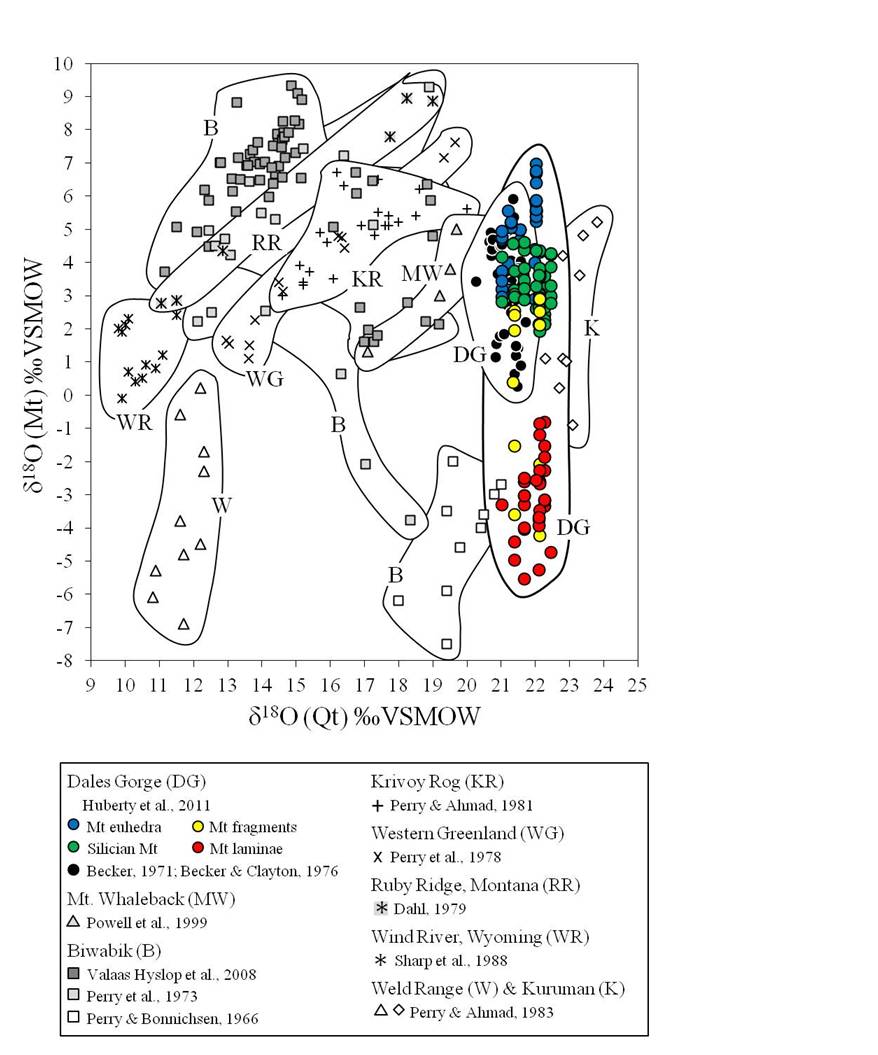
Figure 2. Values of δ18-O for quartz and magnetite for banded iron formations. Colored symbols are for different generations of magnetite from the Dales Gorge BIF, Hamersley (this study).
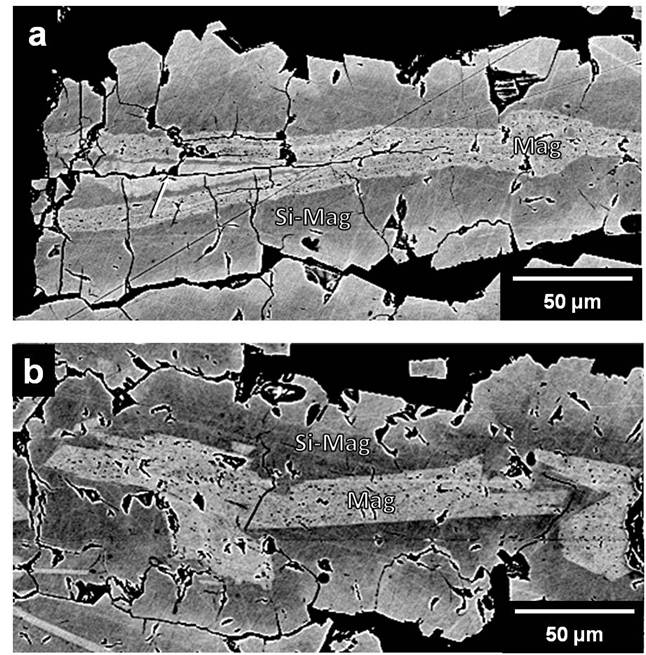
Figure 3. BSE image with grey-scale values distributed to show only magnetite. Individual magnetite microlamina ~100 μm wide are composed of silician magnetite overgrowths (Si-Mag, darker grey) on magnetite (Mag, lighter grey) sub-microlaminae (Fig. 3a) or recrystallized magnetite fragments (Fig. 3b).
Publications
-
Heck, P. R., Huberty, J. M., Kita, N. T., Ushikubo, T., Kozdon, R., & Valley, J. W. (2011). SIMS analyses of silicon and oxygen isotope ratios for quartz from Archean and Paleoproterozoic banded iron formations. Geochimica et Cosmochimica Acta, 75(20), 5879–5891. doi:10.1016/j.gca.2011.07.023
-
Huberty, J. M., Kita, N. T., Kozdon, R., Heck, P. R., Fournelle, J. H., Spicuzza, M. J., … Valley, J. W. (2010). Crystal orientation effects in δ18O for magnetite and hematite by SIMS. Chemical Geology, 276(3-4), 269–283. doi:10.1016/j.chemgeo.2010.06.012
-
Huberty, J. M., Konishi, H., Heck, P. R., Fournelle, J. H., Valley, J. W., & Xu, H. (2012). Silician magnetite from the Dales Gorge Member of the Brockman Iron Formation, Hamersley Group, Western Australia. American Mineralogist, 97(1), 26–37. doi:10.2138/am.2012.3864
-
Kita, N. T., Huberty, J. M., Kozdon, R., Beard, B. L., & Valley, J. W. (2010). High-precision SIMS oxygen, sulfur and iron stable isotope analyses of geological materials: accuracy, surface topography and crystal orientation. Surf. Interface Anal., 43(1-2), 427–431. doi:10.1002/sia.3424
- Huberty, J., Konishi, H., Fournelle, J., Heck, P., Valley, J. & Xu, H. (2010a). Silician Magnetite from the Dales Gorge Banded Iron Formation. Goldschmidt Conference. Geochim. Cosmochim. Acta, Suppl, 74(A434).
- Huberty, J.M., Kita, N.T., Heck, P.R., Kozdon, R., Fournelle, J.H., Xu, H. & Valley, J.W. (2010c). In situ δ18O analyses in quartz and magnetite from the Dales Gorge BIF. 5th International Archean Symposium.
- Kita, N.T., Huberty, J.M. & Valley, J.W. (2010). Improvement of SIMS oxygen isotope analyses on magnetite, 20th V.M. Goldschmidt Conference. Geochimica et Cosmochimica Acta, Suppl, 74(A521).
-
PROJECT INVESTIGATORS:
-
PROJECT MEMBERS:
Huifang Xu
Co-Investigator
Anne-Sophie Bouvier
Postdoc
Philipp Heck
Postdoc
Reinhard Kozdon
Postdoc
Takayuki Ushikubo
Postdoc
Kenneth Williford
Postdoc
John Fournelle
Research Staff
Jim Kern
Research Staff
Hiromi Konishi
Research Staff
Mike Spicuzza
Research Staff
Jason Huberty
Graduate Student
-
RELATED OBJECTIVES:
Objective 4.1
Earth's early biosphere.
Objective 5.2
Co-evolution of microbial communities
Objective 7.1
Biosignatures to be sought in Solar System materials
