2011 Annual Science Report
 Georgia Institute of Technology
Reporting | SEP 2010 – AUG 2011
Georgia Institute of Technology
Reporting | SEP 2010 – AUG 2011
Ribosome Paleontology
Project Summary
The origins of the translation machinery remain imprinted in the extant ribosome. The conformations of ribosomal RNA and protein components can be seen to change over time indicating clear molecular fossils. We are establishing methodology to determine chronologies of ancient ribosomal evolution. It is hypothesized that substantial, though necessarily incomplete evidence, relating to the origins and early development of the translation machinery and its relation to other core cellular processes continues to exist in the primary sequences, three-dimensional folding and functional interactions of the various macromolecules involved in the modern versions of these processes. To this end, we are using ribosomal paleontology to determine the relative age of various ribosomal components and subsystems and thereby develop timelines for the history of the ribosome as a whole as well as various sub processes such as initiation, termination, translocation etc. The results of these studies will interface ribosomal history with other key relating to the origin of life including the emergence time of the genetic code, the origin of chirality and the nature of the last common ancestor. We have also been developing new tools of ribosomal paleontology, to visualize the changes, and to determine timelines for ribosomal origins.
Project Progress
The initial timelines indicate that the peptidyl transferase center (PTC) and parts of the 50S subunit emerged before any aspects of the 30S subunit. As the Fox group recently reported at AbSciCon and the NAI Workshop without walls this has the important implication that the machinery was initially non-coding and hence the ability to make coded peptides was likely not the immediate driving force behind the emergence of the ribosome.
Previous efforts of Bokov and Steinberg (1) have emphasized that the tertiary contacts between different regions of the RNA represent potential timing events. Their analysis utilizes the A minor motif but there are many other types of interactions that may also be employed for this purpose. For example, the terminal A of GNRA tetraloops frequently forms distant interactions that one may be able to use to assign timing. Likewise in many instances tertiary base-base interactions are comprised of a Watson-Crick pair in a stem region involved with a distance base. As in the case of A-minor interactions, the directionality is likely such that the distant interaction is newer than the pairing. Our ongoing efforts are utilizing this additional data to increase the resolution of the hierarchical model that Bokov and Steinberg have created for evolution of the large subunit RNA.
As separate timelines for various subsystems emerge, it is important to examine their compatibility of one approach with others in the hope reaching consistent conclusions. Detailed examination of the exit tunnel, Figure 1, in the past year illustrated that this can be done. The tunnel likely began at the PTC and grew longer over time. In order to accommodate the growing ribosome, the tunnel would have to get longer over time in order for the peptide to emerge. Hence the tunnel length can be correlated with the timing of the enlargement of the RNA and the various additions correlated with and in fact mapped onto a hierarchical model of 23S rRNA evolution. Thus, in the past year the tunnel was found to pass through the Domains in the order V→IV→II→I→III which therefore is their likely relative times of addition. This is in agreement with the Bokov and Steinberg model as well as the Williams group’s onion model (2) and the Fox group’s earlier results based on connectivity (3). The mRNA channel in the 30S subunit may provide similar insights. In this case, the timing is likely bidirectional emanating from the decoding center.
It is our view that the level of complexity that characterizes LUCA is not accidental, but rather reflects that state of things when a globally important event in biological evolution occurred. The most likely candidate for this event is the greatly improved control of the characteristic movements of the ribosome that would be contributed by the addition of the GTPase Center to the ribosome. This would have accelerated peptidyl transfer by at least an order of magnitude and thus allowed major expansion in the capabilities of the primitive living systems then extant. The GTPase center would, however, have needed to be integrated into the ribosome inner workings and to do this it is likely that a signaling system would be needed to facilitate timing of GTP cleavages. Thus, all the ribosomal processes and components that are evolving at the LUCA boundary are likely to be of special interest. One such component is 5S rRNA, which is centrally located on a path, Figure 2, which ultimately connects the PTC in the 50S subunit to the decoding center in the 30S subunit. Previously a large number of 5S rRNA mutants were constructed for studies of the structure of RNA sequence space. Ongoing efforts are focused on characterizing these variants from the perspective of ribosome function. Mutations at U78 where the A-site finger crosses 5S rRNA are especially deleterious.
Primary and secondary structures of rRNAs (ribosomal RNAs) and rProteins (ribosomal proteins) are available for a large number of species. Atomic-resolution three-dimensional (3D) structures of ribosomes are available for a few species (Figure 3). These 3D structures are information dense, revealing tertiary structural information as well as primary and secondary structural data. Information contained in the small subset of available 3D structures, can be extrapolated to other species.
To visualize the structural and evolutionary data we have been developing a software that readily and quickly transfers information between 1D (primary structure), 2D (secondary structure), and 3D (tertiary structure) spaces. Primary structure is used for sequence-alignments and therefore contains information on genetic variability. Secondary structure contains local organizational information and describes folding, motifs, functional and evolutionary units (helices and domains). Tertiary structure contains atomic level detail, including conformation and molecular interactions. Additionally, diverse information such as results of footprinting experiments, evolutionary data, and physicochemical properties can also be mapped onto any of the three spaces.
The simultaneous representation of multiple types of data (Figure 4) for the whole ribosome in several dimensional spaces provides a powerful approach for detecting correlations between the variables. Our procedure is automated, allowing for high throughput. Through creative use of colors, symbols, and hyperlinks many types of information can be analyzed simultaneously (Figure 5).
Our method allows us to present novel information about the roles of rRNA and rProteins, which were elucidated from analyzing rRNA-rRNA and protein-rRNA contact maps projected onto the secondary structure of the ribosome. Our automated data processing and visualization software allows us to filter the contact maps based on sequence conservation, the conservation of a physicochemical property, or any other residue level property. The data can be projected onto ribosomal secondary structure per rRNA residue basis as well as grouped using coarser-grained representations of rRNA (per helix or per domain bases).
References
1. Bokov K, Steinberg SV (2009) A Hierarchical Model for Evolution of 23S Ribosomal RNA. Nature 457:977-980.
2. Hsiao C, Mohan S, Kalahar BK, Williams LD (2009) Peeling the Onion: Ribosomes Are Ancient Molecular Fossils. Mol Biol Evol 26:2415-2425.
3. Hury J, Nagaswamy U, Larios-Sanz M, Fox GE (2006) Ribosome Origins: The Relative Age of 23S rRNA Domains. Orig Life Evol Biosph 36:421-429.
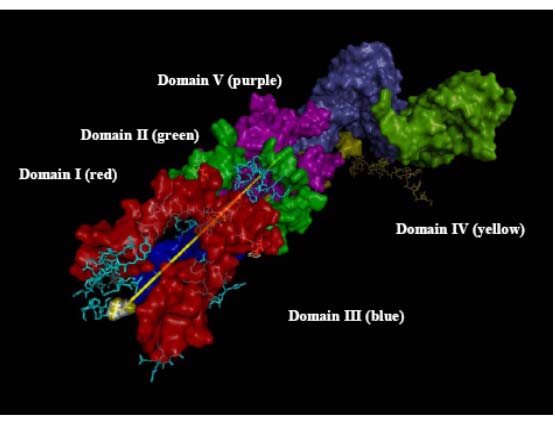
RNA components that form the exit tunnel (yellow line denotes path) from PTC in Domain V to the back of the 50S subunit where it exits in Domain 1II.
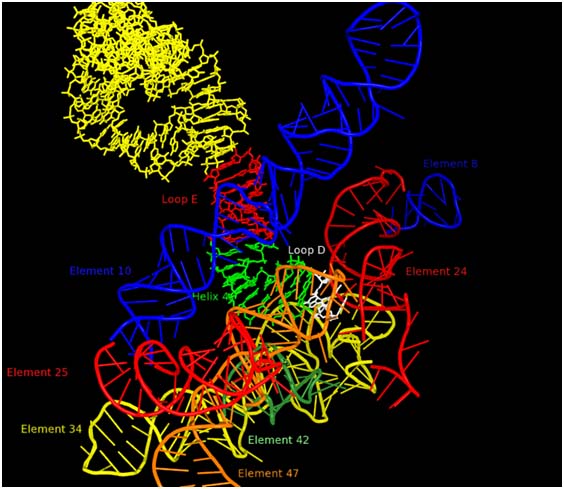
RNA environment in 50S subunit surrounding 5S rRNA Loop D (white). Other portions of the 5S rRNA are indicated in yellow, red (loop E) and green (helix 4). The various regions of 23S rRNA structure are labeled as “elements” using the nomenclature of Bokov and Steinberg and each is colored separately. Element 10, also known as the A-site finger crosses 5S rRNA in close proximity of Loop E.
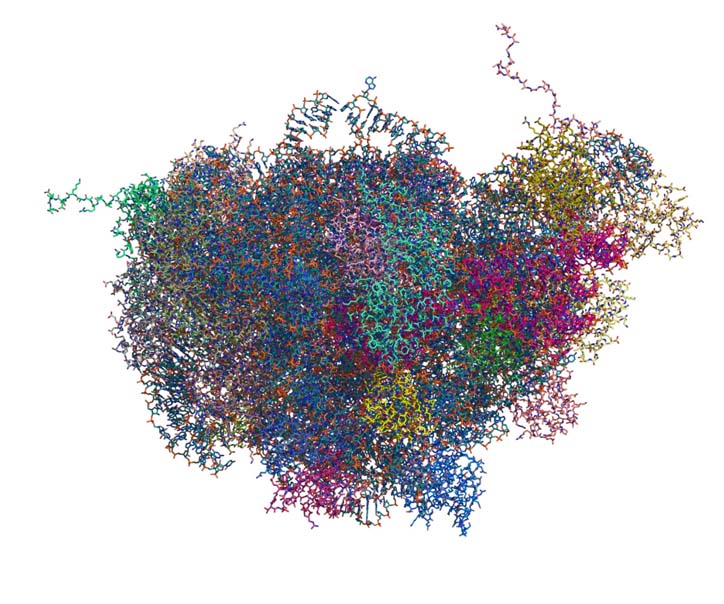
All atom structure of Large Ribosomal Subunit (LSU) of Thermus Thermophilus. Atomic positions are extracted from the crystal structure (PDB ID: 2J01). Each chain of LSU (16S rRNA, 5S rRNA and 30 rProreins) is colored individually. This figure illustrates the complexity of the interactions within ribosomal LSU in the 3D space at the atomic level.

Pairwise molecular interactions between the helices of Thermus Thermophilus. The color represents the number of intereactions. “Molecular interactions” include magnesium-base, phosphate-base, base-base, and stacking interactions. The box denotes interactions between the helices in Domain II and Domain V. This figure demonstrates that the interactions can be analyzed independently of ribosomal representation.
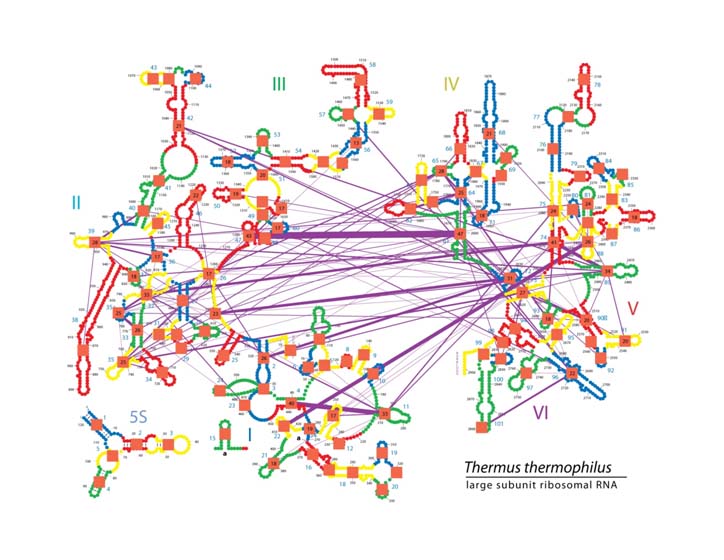
Pairwise molecular interactions between the helices of Thermus Thermophilus mapped on the secondary structure of 16S and 5S rRNA of LSU. RNA helices are depicted in different colors (red, yellow, blue, green). Boundary between two colors visually defines subset of residues within each helix. The helical indices are shown by blue numbers located next to each helix. The interactions between helices are shown by purple lines. The thickness of lines is proportional to number of individual interactions (phosphate-base, base-base, and stacking interactions) between given pair of helices. The total number of contacts for a given helix is shown by a number inside the orange square. For simplicity, only helices that have contacts with at least nine other helices are shown. This figure illustrates that many layers of structural information can be mapped on the ribosomal secondary structure using variety of colors, symbols, and geometrical objects.
Publications
-
Dasgupta, I., Gao, X., & Fox, G. E. (2011). Structural properties of DNA oligomers containing (GACX)n and (GAXC)n tandem repeats. Biopolymers, 97(3), 155–164. doi:10.1002/bip.21719
-
Fox, G. E., Tran, Q., & Yonath, A. (2012). An Exit Cavity Was Crucial to the Polymerase Activity of the Early Ribosome. Astrobiology, 12(1), 57–60. doi:10.1089/ast.2011.0692
-
Liu, Y., Stepanov, V. G., Strych, U., Willson, R. C., Jackson, G. W., & Fox, G. E. (2010). DNAzyme-mediated recovery of small recombinant RNAs from a 5S rRNA-derived chimera expressed in Escherichia coli. BMC Biotechnol, 10(1), 85. doi:10.1186/1472-6750-10-85
-
Lu, Q., & Fox, G. E. (2011). Resurrection of an ancestral 5S rRNA. BMC Evolutionary Biology, 11(1), 218. doi:10.1186/1471-2148-11-218
-
Nayar, M., & Fox, G. E. (2011). Defining 5S rRNA Structure Space: Point Mutation Data Can Be Used to Predict the Phenotype of Multichange Variants. Molecular Biology and Evolution, 28(9), 2629–2636. doi:10.1093/molbev/msr090
-
Zhao, Q., Huang, H-C., Nagaswamy, U., Xia, Y., Gao, X., & Fox, G. E. (2012). UNAC tetraloops: to what extent do they mimic GNRA tetraloops?. Biopolymers, 97(8), 617–628. doi:10.1002/bip.22049
- Fox, G.E. (2011). The evolutionary history of the ribosome and its relevance to the search for life elsewhere in the universe. SPIE Conference 8152.
-
PROJECT INVESTIGATORS:
-
PROJECT MEMBERS:
Dana Cook-Schneider
Postdoc
Chiaolong Hsiao
Postdoc
Victor Stepanov
Postdoc
Jessica Bowman
Research Staff
Chad Bernier
Graduate Student
-
RELATED OBJECTIVES:
Objective 3.2
Origins and evolution of functional biomolecules
Objective 4.2
Production of complex life.

