2009 Annual Science Report
 Arizona State University
Reporting | JUL 2008 – AUG 2009
Arizona State University
Reporting | JUL 2008 – AUG 2009
Astrophysical Controls on the Elements of Life, Task 7: Update Catalog of Elemental Ratios in Nearby Stars
Project Summary
We are making 3D maps of the elements in stars within 1000 light-years of the Sun. When completed, these maps will be useful for discovering whether there are neighborhoods or streams of stars more favorable to Earth-like planets and life as we know it.
Project Progress
This effort has resulted in two papers in preparation.
The first paper, by graduate student Nahks Tr’Ehnl, co-I Frank Timmes and collaborator Maggie Turnbull, is an update to a subset, about 1000 field dwarf stars, of the Habitable Star Catalog (HabCat) with spectroscopically derived elemental abundances of C,N, O, Mg, Si, S, and Fe scoured from the public data archives and being critically evaluated (different measurements yield different abundances). A smaller subset of HabCat, about 100 field dwarfs, has isotopic abundances of Mg, Si, S, and Ti. Distance estimates to these subsets of HabCat stars are being updated, and 3D maps of the abundance patterns within 1000 light years of the Sun are being analyzed. A public database of these subsets is being assembled (Figure 1).
The second paper, by graduate student Mike Pagano, collaborators Patrick Young and Jade Bond, and co-I Frank Timmes, leverages published elemental abundances of C, O, Na, Mg, al, Si, Ca, Ti, Cr, Ni, Y, Ba, Nd, and Eu derived from high-resolution spectroscopy from about radial velocity planet searches. In this paper we construct linear fits to the abundance trends to evaluate the mean trends and construct mean-field chemical evolution models of the abundances. We discuss the astrobiological implications of the Sun being anomalous in a few elements (notably Al) compared to 130 nearby dwarfs.
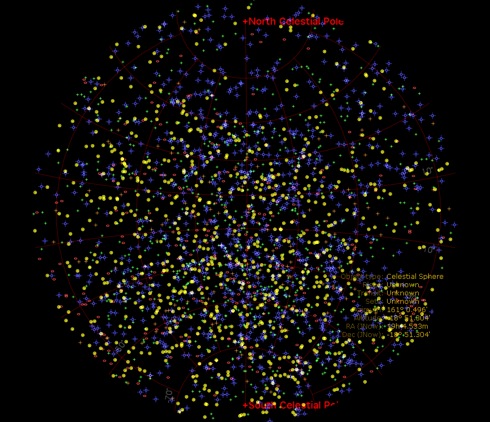
Figure 1. Element variations in nearby stars. Map of the iron to hydrogen ratio measured by photometery in stars projected onto the celestial sphere. Color indicate abundance level relative to the Sun on a logarithmic scale; red indicates large [Fe/H] values, yellow solar-like [Fe/H] values, and blue low [Fe/H] values.
Publications
- Pagano, M., Young, P.A. & Timmes, F.X. (2009). Abundance variation of dwarfs in the solar neighborhood. Astrophysical Journal.
- Tr’Enhl, N., Timmes, F.X. & Turnbull, M. (2010). Abundance maps of dwarf stars within 1000 light years.
-
PROJECT INVESTIGATORS:
-
PROJECT MEMBERS:
Margaret Turnbull
Co-Investigator
Patrick Young
Co-Investigator
Jade Bond
Collaborator
Michael Pagano
Graduate Student
Nahks Tr'Ehnl
Graduate Student
-
RELATED OBJECTIVES:
Objective 1.1
Formation and evolution of habitable planets.
Objective 7.2
Biosignatures to be sought in nearby planetary systems
