2015 Annual Science Report
 Massachusetts Institute of Technology
Reporting | JAN 2015 – DEC 2015
Massachusetts Institute of Technology
Reporting | JAN 2015 – DEC 2015
Early Animals: Evolution of Complex Multicellularity
Project Summary
Oxygen availability has long been viewed as a principal deriver of Ediacaran-Cambrian animal diversification, yet quantitative constraints on oxygen history and physiological constraints on animal function at low pO2 have been limited. New statistical analyses of iron-sepciation data for Proterozoic and Paleozoic shales indicate that end-Proterozoic oxygen increase was limited, but physiologial insights from present day oxygen minimum zones indicate that oxygen levels may well have crossed the theshold reuqired from large diverse animals that include carnivores.
Project Progress
Iron-based proxies are among our most effective tools for tracking the redox chemistry of ancient oceans. These proxies are inherently local, but gain global significance when analyzed collectively and statistically. We analyzed ~4700 iron speciation measurements (842 new) from 2300-360 Ma shales. Our statistical analyses suggest that subsurface water masses in mid-Proterozoic oceans were predominantly anoxic and ferruginous, but with a tendency towards euxinia not observed in the Neoproterozoic Era. Analyses further indicate that early animals did not experience appreciable benthic sulfide stress. Finally, unlike proxies based on redox sensitive trace metal abundances, iron geochemical data do not show a statistically significant change in oxygen content through the Ediacaran and Cambrian periods, sharply constraining the magnitude of end-Proterozoic pO2 increase. Re-analysis of trace metal data is in fact consistent withoxygenation continuing well into the Paleozoic Era. Thus, if changing O2 facilitated animal diversification, it did so through a limited rise past critical functional/ecological thresholds, as seen in modern Oxygen Minimum Zone benthos (Sperling et al., 2015a).
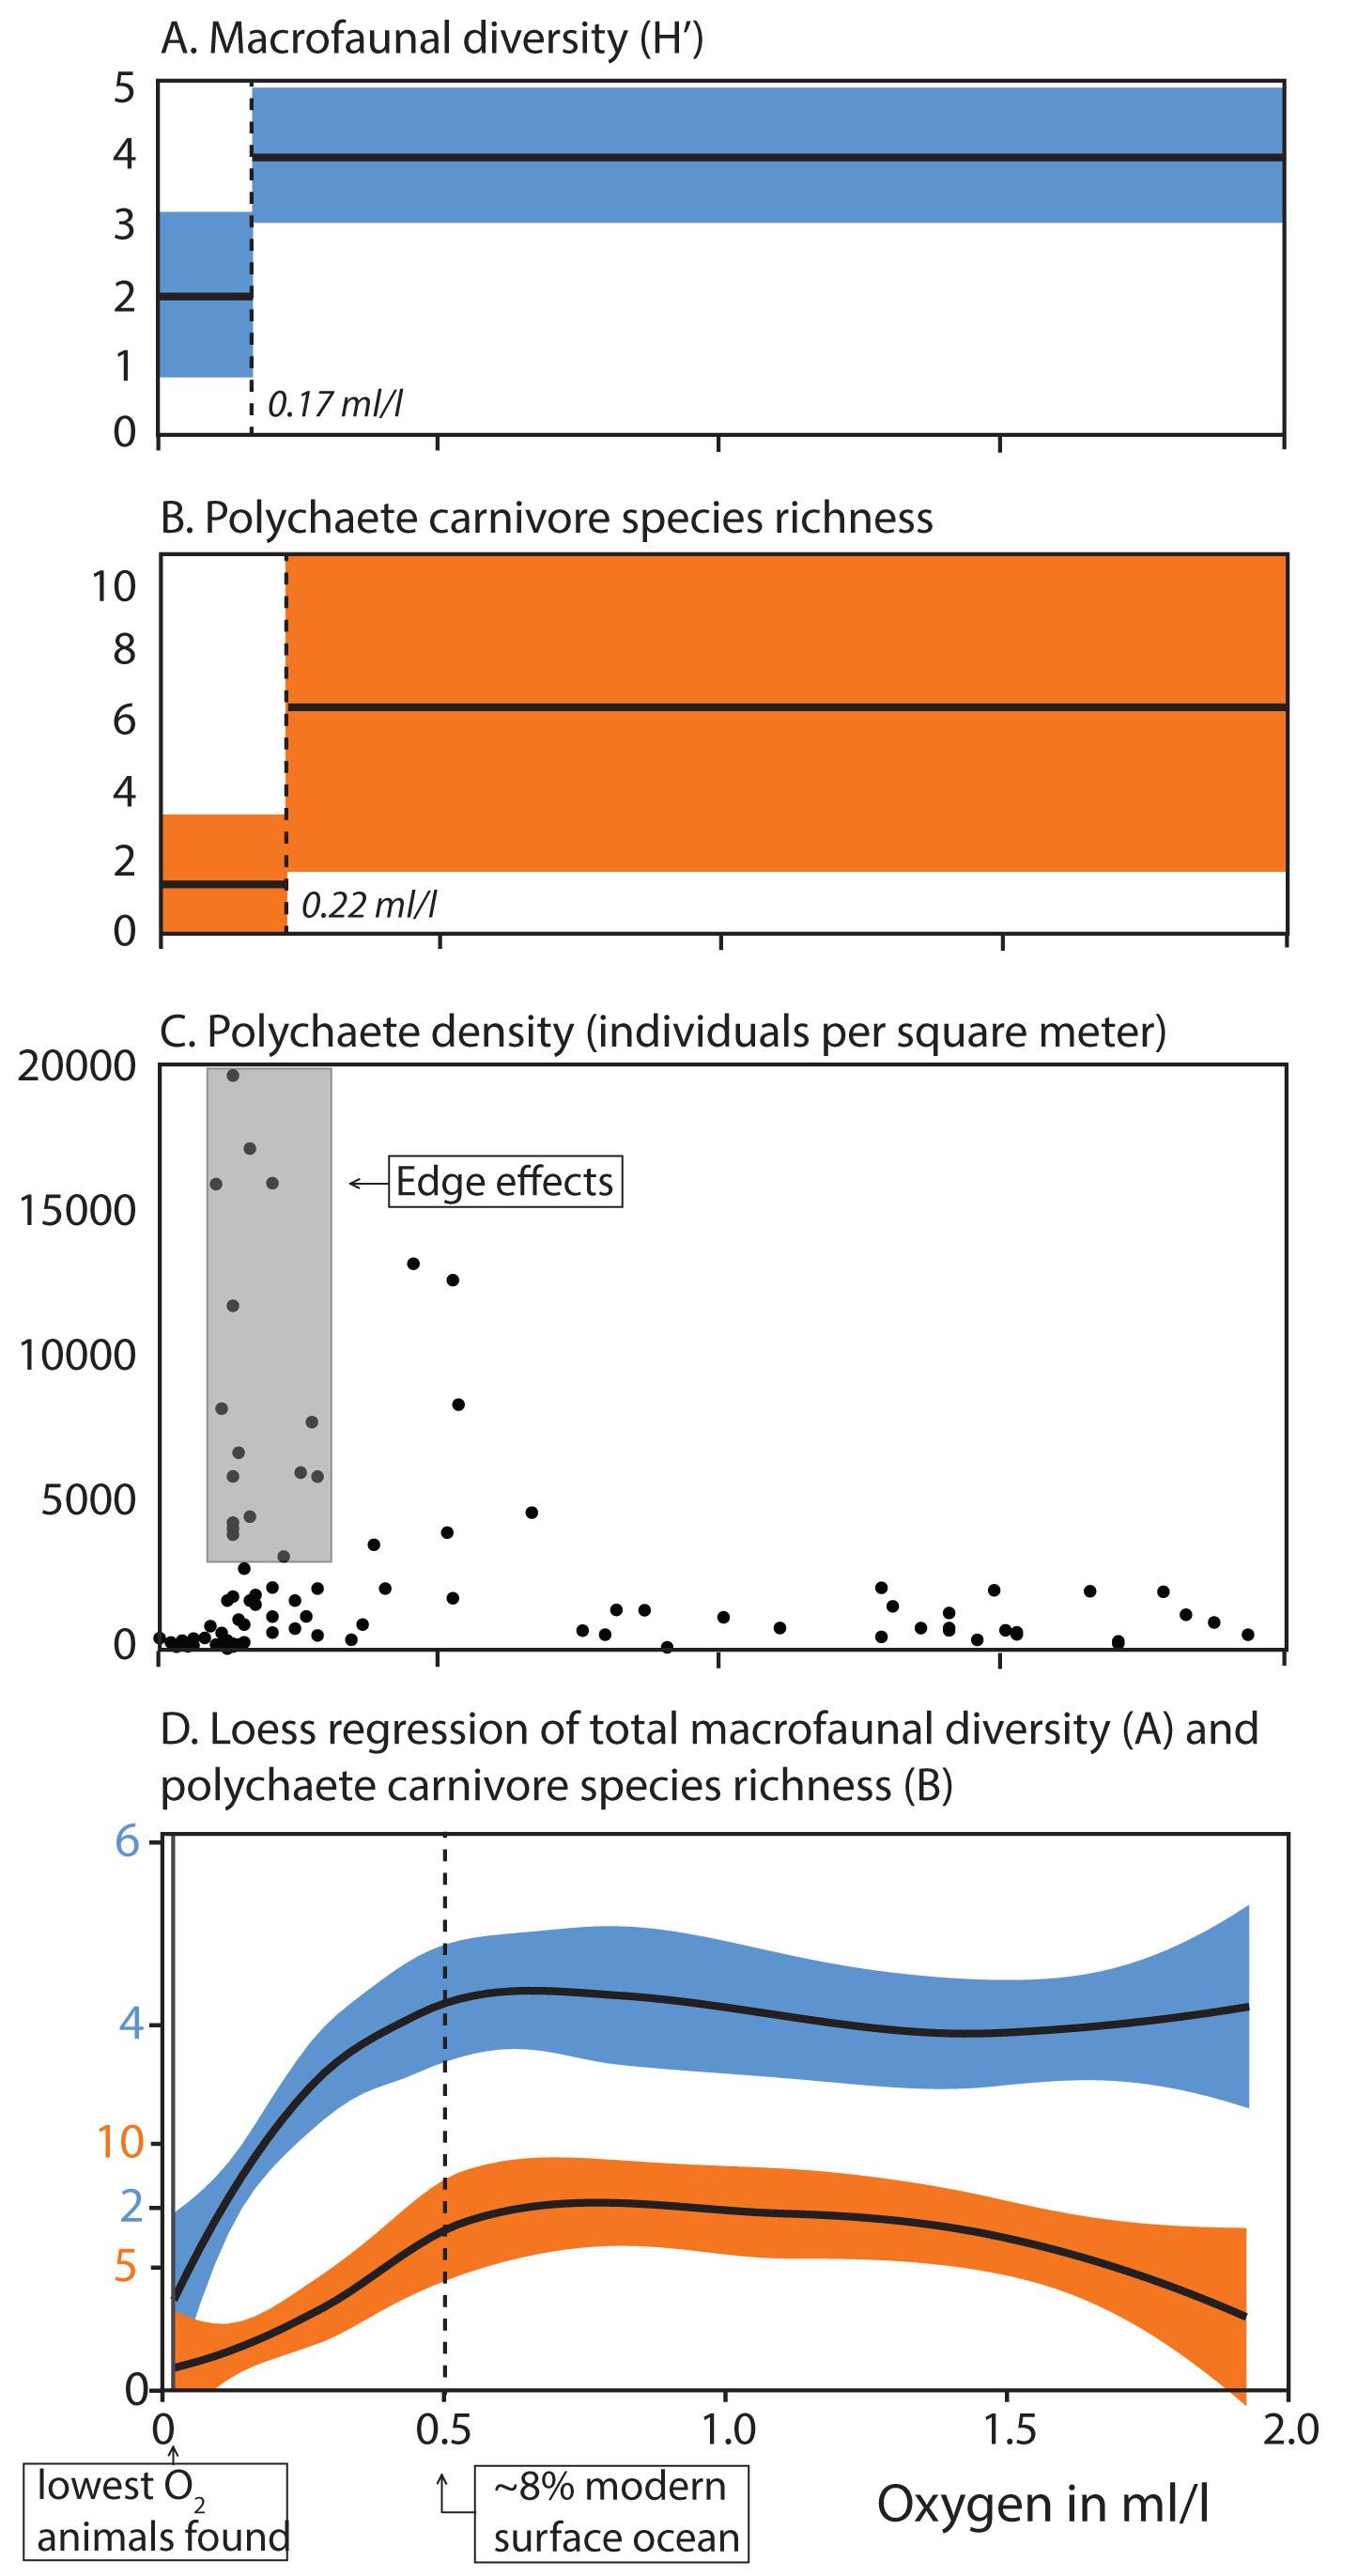
Living animals display a variety of morphological, physiological and biochemical characters that enable them to live in low oxygen environments. These features and the organisms that have evolved them are distributed in a regular pattern across O2 gradients associated with modern oxygen minimum zones, providing a template for interpreting the stratigraphic covariance between inferred Ediacaran-Cambrian oxygenation and early animal diversification. Although Cambrian oxygen must have reached 10-20% of modern levels, sufficient to support the animal diversity recorded by fossils, it may not have been much higher than this, approaching today’s level only later in the Paleozoic Era. Nonetheless, Ediacaran-Cambrian oxygenation may have pushed surface environments across the low, but critical, physiological thresholds required for large active animals, especially carnivores (Sperling et al., 2015b).
Publications
-
Sperling, E. A., Knoll, A. H., & Girguis, P. R. (2015). The Ecological Physiology of Earth’s Second Oxygen Revolution. Annual Review of Ecology, Evolution, and Systematics, 46(1), 215–235. doi:10.1146/annurev-ecolsys-110512-135808
-
Sperling, E. A., Wolock, C. J., Morgan, A. S., Gill, B. C., Kunzmann, M., Halverson, G. P., … Johnston, D. T. (2015). Statistical analysis of iron geochemical data suggests limited late Proterozoic oxygenation. Nature, 523(7561), 451–454. doi:10.1038/nature14589
-
PROJECT INVESTIGATORS:
-
PROJECT MEMBERS:
David Johnston
Co-Investigator
Francis Macdonald
Co-Investigator
Erik Sperling
Co-Investigator
Peter Girguis
Collaborator
-
RELATED OBJECTIVES:
Objective 4.1
Earth's early biosphere.
Objective 4.2
Production of complex life.
