2015 Annual Science Report
 NASA Goddard Space Flight Center
Reporting | JAN 2015 – DEC 2015
NASA Goddard Space Flight Center
Reporting | JAN 2015 – DEC 2015
Serial Measurements of the Volatile Composition of Comet D/2012 S1 (ISON) between 1.2 and 0.34 AU from the Sun
Project Summary
The composition of ices and rocky material in cometary nuclei is central to understanding their origins, and to assessing their possible roles in delivering water and prebiotic organic compounds to the young Earth. For most comets, measurements of primary volatiles (ices contained in the cometary nucleus) exist for only a single date or for very few dates, questioning whether such ‘momentary’ measurements represent the bulk content of the nucleus. The early discovery of the dynamically new, sun-grazing comet C/2012 S1 (ISON) was extremely rare in that it permitted measurements of the abundances of sublimed ices over a large range of heliocentric distance (Rh). As part of a world-wide observing campaign, world-class astronomical observatories provided large amounts of observing time dedicated to studying Comet ISON. Using high-resolution infrared spectroscopy at Keck-2 and the NASA-IRTF, the GCA Team measured production rates for H2O and eight trace gases (CO, C2H6, CH4, CH3OH, NH3, H2CO, HCN, C2H2) on ten pre-perihelion dates that spanned heliocentric distances ranging from 1.21 to 0.34 AU. This project addressed the evolution in molecular production and composition as the comet approached the Sun. GCA members also investigated the spatial distribution of H2O in the near-nucleus coma to identify modes of water release and of heat injection by release from icy grains, and they conducted a sensitive search for HDO to test the potential delivery of Earth’s oceans by such comets.
Project Progress
We measured production rates for H2O and eight trace molecules (CO, C2H6, CH4, CH3OH, NH3, H2CO, HCN, and C2H2) using high-resolution spectroscopy at Keck-2 and the NASA-IRTF on ten pre-perihelion dates encompassing heliocentric distances (Rh) = 1.21 – 0.34 AU. During this period Comet ISON exhibited two major outbursts, the first near 0.6 – 0.7 AU, and the second near 0.4 AU. Our data span this evolution in activity and reveal significant changes in the apparent composition of certain primary volatiles, prior to the comet’s complete disruption as it neared perihelion (approaching and within 0.1 AU of the Sun). Our rich dataset contains as yet unexplored information on the detailed processes involved.
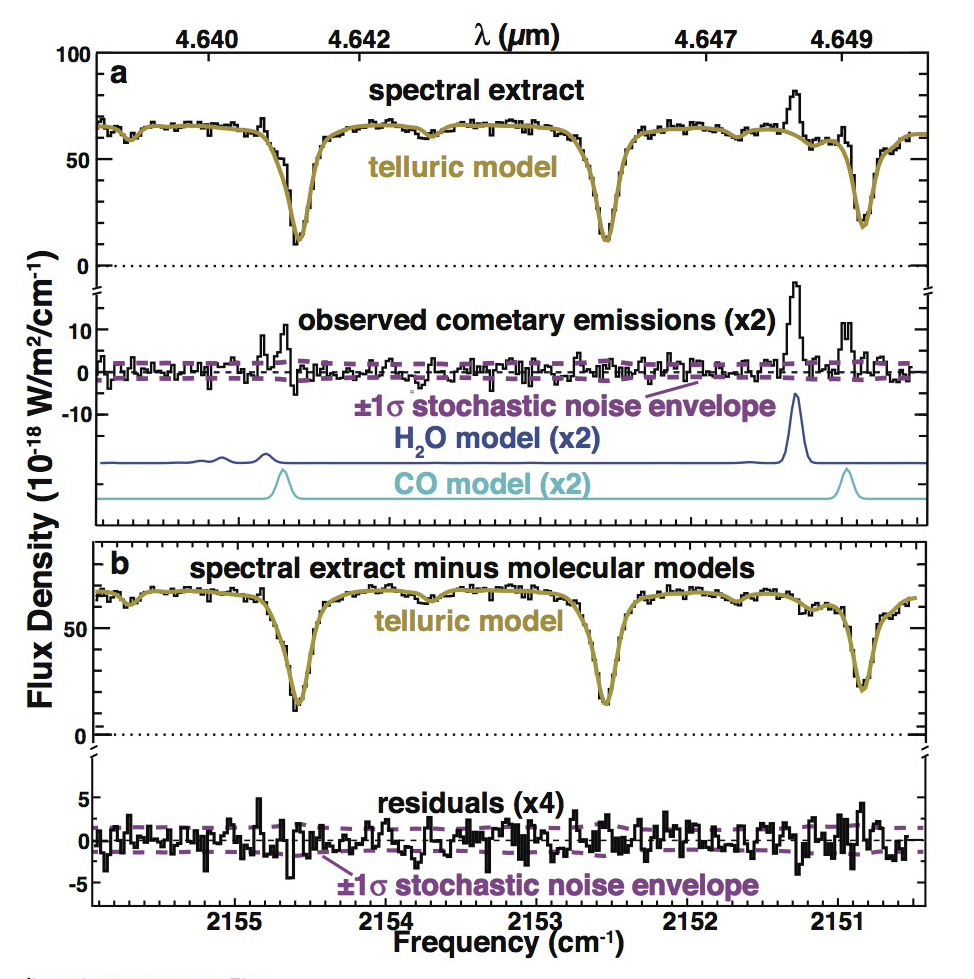
For each measurement, spectra were extracted by summing signal spatially along the slit in an aperture centered on the peak emission intensity. From these spectra, telluric and cometary contributions were established by means of an iterative approach we developed and that is detailed in the paper (Figure 1).
Measured water production rates spanned two orders of magnitude, and appeared to track periods of both “outburst” and “baseline” activity as reported by other observers. A fit to our baseline measurements was consistent with a heliocentric power law Q(H2O) ~ Rh-n, with n = -3.1 ± 0.1 (Figure 2).
![Figure 2: Evolution of water production in Comet ISON prior to its complete disruption. The various NIRSPEC results shown for a given date were obtained simultaneously; the points on November 7 are separated horizontally only to visualize them more clearly. Of the 32 measurements, seven (in dashed boxes) were associated with periods of enhanced water production (i.e., with “outbursts”). A heliocentric fit excluding these seven points (dot-dashed line) results in a power law [Q(H<sub>2</sub>O) = (1.89 ± 0.11) x 10[^28^] R<sub>h</sub><sup>-n</sup>, with n = 3.10 ± 0.1) molecules s<sup>-1</sup>] that represents the evolution of water production in Comet ISON within the terrestrial planets region.](../../../../media/medialibrary/2016/06/Fig2_2.jpg)
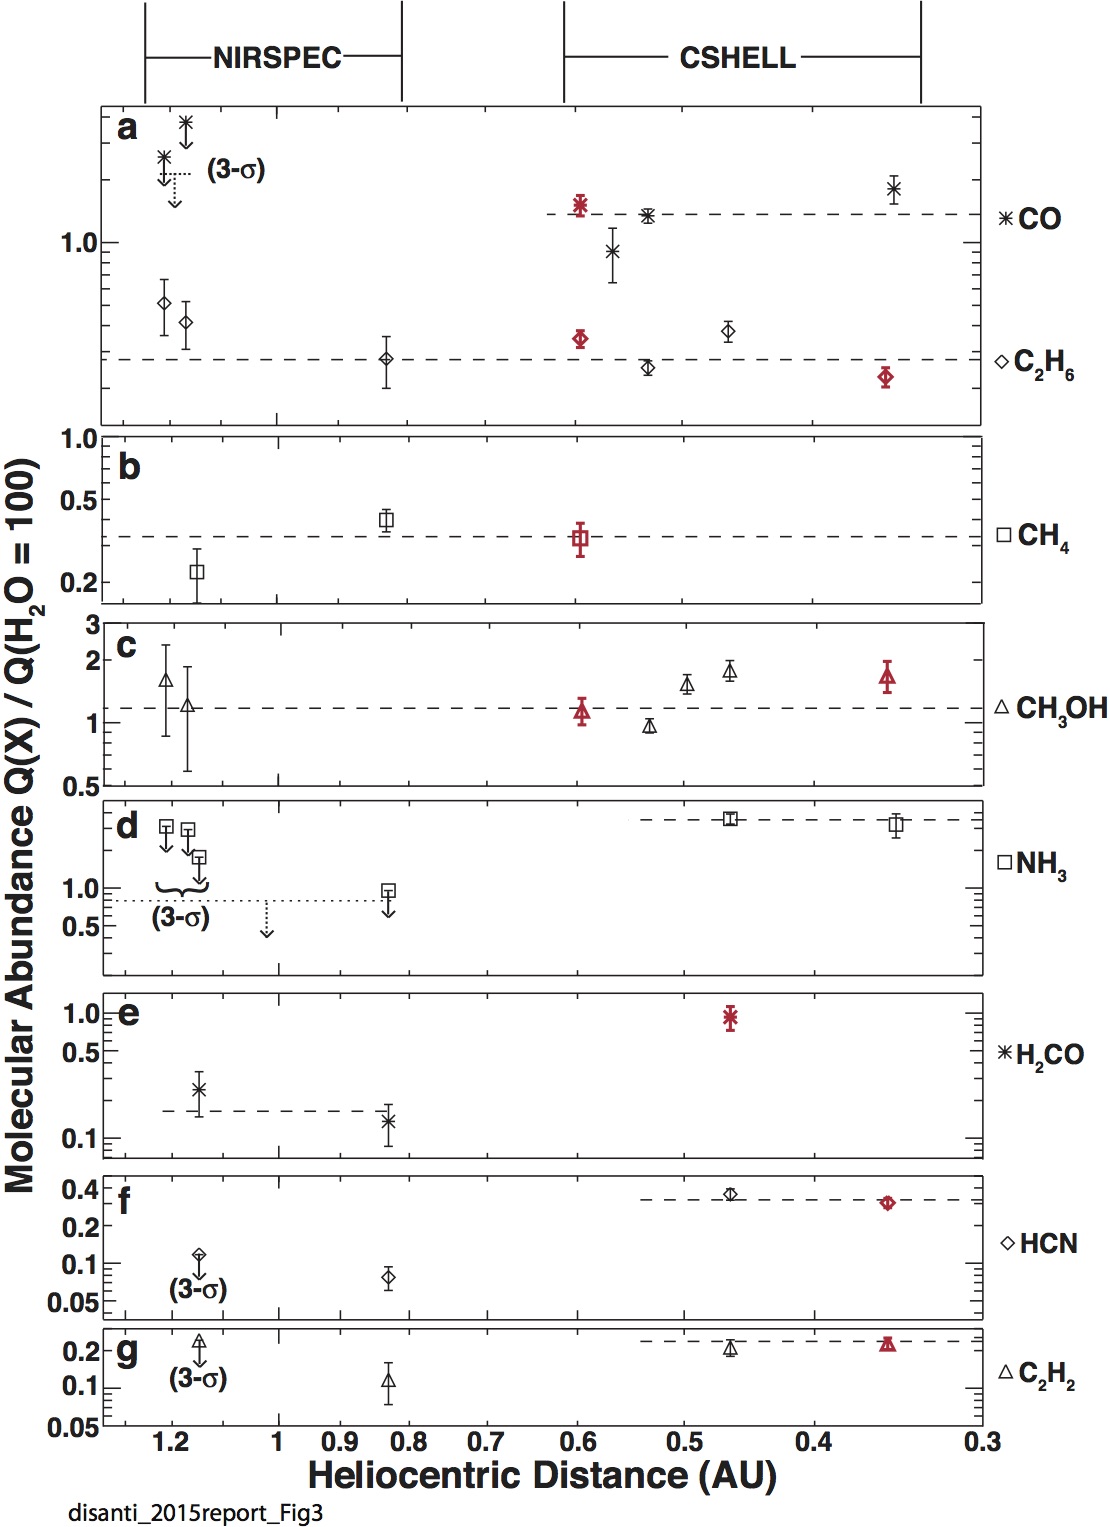
Abundance ratios for CO, C2H6, and CH4 with respect to H2O were relatively constant with Rh, and were smaller than their corresponding mean ratios measured among a dominant sample of Oort cloud comets. CH3OH was also depleted for Rh > 0.5 AU, but was closer to its mean value for Rh ≤ 0.5 AU. The remaining four gases exhibited higher abundance ratios within 0.5 AU: for Rh > 0.8 AU, NH3 and C2H2 were consistent with their mean values while H2CO and HCN were depleted. For Rh < 0.5 AU all four were enriched, with NH3, H2CO, and HCN increasing most (Fig. 3).
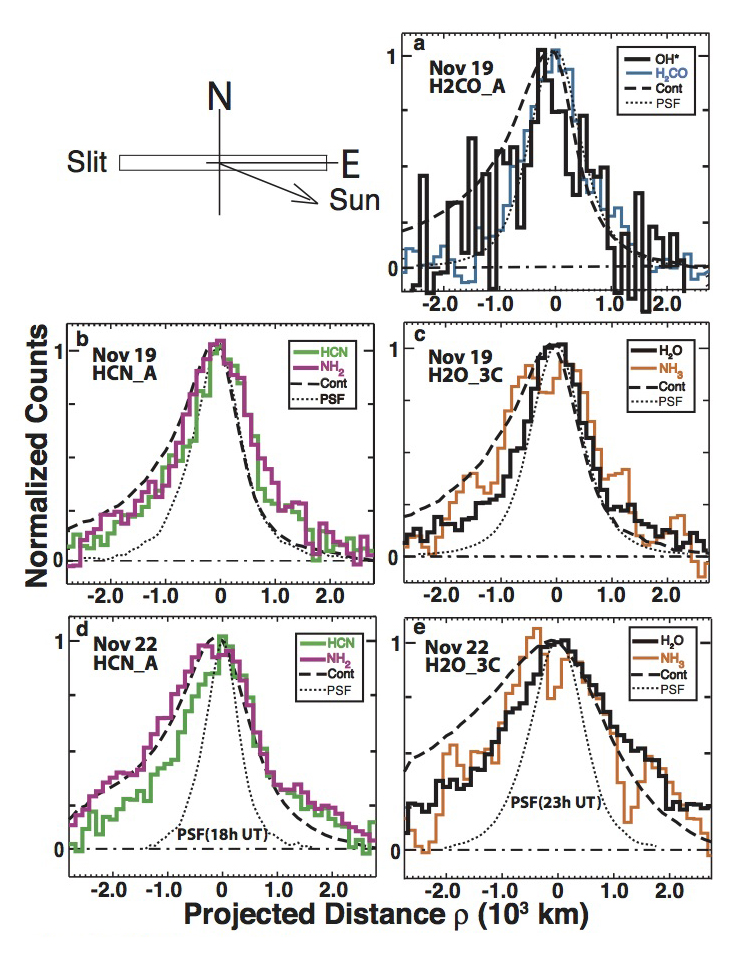
Spatial profiles of gas emission in ISON consistently peaked sunward of the dust continuum, which peaked anti-sunward and displayed a single peak throughout our observing period. Within 0.5 AU, NH3 showed a broad spatial distribution, possibly indicating its release in the coma (if optical depth effects were unimportant). The column abundance ratio NH2/H2O at 0.83 AU was close to the “typical” value for NH/OH from optical wavelengths, but was higher within 0.5 AU. Establishing its production rate and testing its parent (e.g., NH3) requires modeling of coma outflow, but this is deferred to a future reporting period.
Publications
- DiSanti, M.A., Bonev, B. P., Gibb, E. L., Paganini, L., Villanueva, G. L., Mumma, M. J., et al. (2016). En route to destruction: The evolution in composition of ices in Comet D/2012 S1 (ISON) between 1.2 and 0.34 AU from the Sun as revealed at infrared wavelengths. Volume 820, Number .1 Astrophysical J.
- Gibb, E. L., Bonev, B. P., DiSanti, M. A., Villanueva, G. L., Paganini, L., & Mumma, M. J. (2016). An infrared search for HDO in Comet D/2012 S1 (ISON) and implications for iSHELL. The Astrophysical Journal, 816(2), 101. doi:10.3847/0004-637x/816/2/101
-
PROJECT INVESTIGATORS:
-
PROJECT MEMBERS:
Boncho Bonev
Co-Investigator
Erika Gibb
Co-Investigator
Michael Mumma
Co-Investigator
Lucas Paganini
Co-Investigator
Geronimo Villanueva
Co-Investigator
Geoffrey Blake
Collaborator
Jacqueline Keane
Collaborator
Karen Meech
Collaborator
-
RELATED OBJECTIVES:
Objective 3.1
Sources of prebiotic materials and catalysts
Objective 3.2
Origins and evolution of functional biomolecules
