2013 Annual Science Report
 NASA Jet Propulsion Laboratory - Titan
Reporting | SEP 2012 – AUG 2013
NASA Jet Propulsion Laboratory - Titan
Reporting | SEP 2012 – AUG 2013
Task 2.1.2.2: Shortwave Solar Flux at Titan’s Surface
Project Summary
What can we learn about pre-biotic chemistry by studying Titan? The surface of Titan is a special place for the study of pre-biotic chemistry because that is where the organic haze sedimenting from the atmosphere can come in contact with liquid water (briefly, from cryovolcanic eruptions) to form amino acids and other molecules relevant to life. But an energy source is also needed, and this may come from short-wave (ultraviolet – blue) solar radiation that makes its way through Titan’s dense haze layer to the surface. In this study we calculated the amount of UV-blue solar flux at Titan’s surface based on measurements made by the Descent Imager/Spectral Radiometer (DISR) instrument on the Huygens Probe coupled with radiative transfer models that include haze optical properties.
Project Progress
Our best violet/uv models were constructed by extrapolating the optical depth and single scattering albedo derived from DISR observations, but then making minimal adjustments to them to fit the observed violet channel fluxes. The phase function was computed from the Mark Lemmon algorithm for these wavelengths. The optical depths in the three altitude regions were revised slightly from the power laws given in figure 46 of Tomasko et al., 2008. The new values are
Above 80 km: τ = 1.096E07*λ-2.343
30 – 80 km: τ = 3.505E04*λ-1.486
Under 30 km: τ = 5.859E02*λ-0.9555
(λ in nm)
The single scattering albedos were extrapolated (and then adjusted) using polynomial fits vs. wavelength.
Above 144 km: w0 = 0.0910 + 2.4393*λ – 1.7313*λ2
30 – 80 km: w0 = 0.8360 + 0.09691*λ+ 0.2559*λ2
Under 30 km: w0 = -0.5089 + 5.5159*λ – 5.0938*λ2
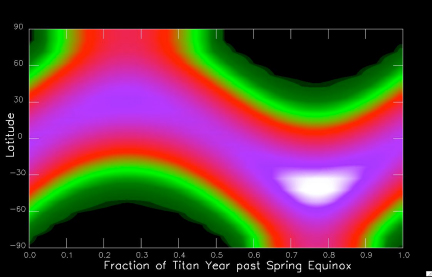
We also calculated diurnal-average solar fluxes at 400 nm shown in Figure 1. The seasonal pattern shown in Fig. 1 is a familiar one, with greatest solar flux at southern latitudes near northern winter solstice (due to Saturn’s perigee being nearly in phase with winter solstice), but the latitude of maximum solar flux is displaced toward the equator relative to calculations of the direct solar flux due to the effects of diffuse transmission through a thick atmosphere. These calculations enable estimates of possible surface chemical reactions stimulated by short-wave solar flux.
Reference:
Tomasko, M.G., L. Doose, S. Engel, L.E. Dafoe, R. West, M. Lemmon, E. Karkoschka, C. See, A model of Titan’s aerosols based on measurements made inside the atmosphere, Planetary and Space Science 56, 669–707, 2008.
-
PROJECT INVESTIGATORS:
-
PROJECT MEMBERS:
Robert West
Project Investigator
Murthy Gudipati
Co-Investigator
Lyn Doose
Collaborator
Erich Karkoschka
Collaborator
Charles See
Collaborator
Martin Toasko
Collaborator
-
RELATED OBJECTIVES:
Objective 2.2
Outer Solar System exploration
Objective 3.1
Sources of prebiotic materials and catalysts
Objective 3.2
Origins and evolution of functional biomolecules
Objective 3.3
Origins of energy transduction