2013 Annual Science Report
 NASA Jet Propulsion Laboratory - Icy Worlds
Reporting | SEP 2012 – AUG 2013
NASA Jet Propulsion Laboratory - Icy Worlds
Reporting | SEP 2012 – AUG 2013
Investigation 3: Detectability of Icy Worlds
Project Summary
Detectability of Icy Worlds investigates the detectability of life and biological materials on the surface of icy worlds, with a focus on spectroscopic techniques, and on spectral bands that are not in some way connected to photosynthesis.The primary component of Investigation 3 is the field campaign in Barrow, AK to characterize and quantify methane release from the Alaskan North Slope region and to understand the origin and fate of the methane.
Project Progress
Investigation 3: Detectability of Icy Worlds
Co-I Hand published two papers about the surface chemistry of Europa, both partially supported by NAI. Using the Keck II telescope Hand and colleague Mike Brown of Caltech mapped the surface of Europa in the infrared. In the first paper (Brown & Hand, 2013) described observations of a new spectroscopic feature at 2.07 µm on the trailing hemisphere, which suggests that the trailing hemisphere of Europa may have magnesium sulfate salts produced from the irradiation of endogenous chlorine salts from the subsurface ocean.
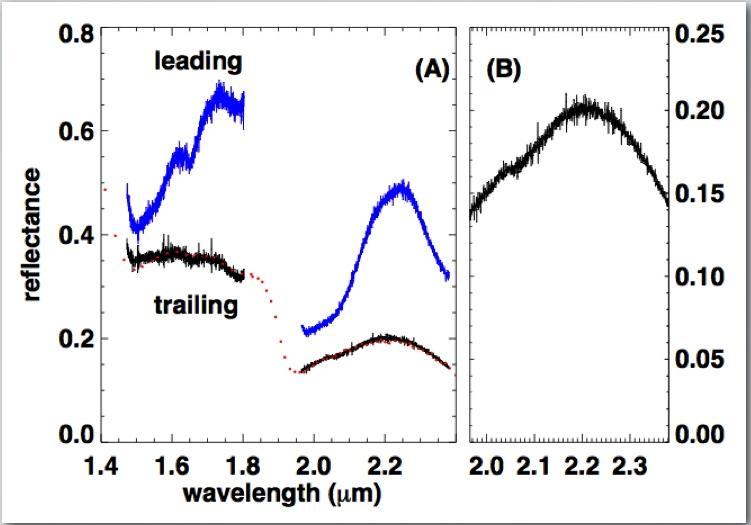
We propose that upon irradiation the endogenous magnesium combines with exogenous, Iogenic sulfur to yield the observed magnesium sulfate. The spectroscopic signature of the magnesium sulfate is seen on the trailing but not the leading hemisphere, leading to the radiolytic interpretation of the production of this compound. Coupled with this pathway, the radiolytic chemistry occurring on Europa’s surface yields significant hydrogen peroxide on the leading hemisphere, but not the trailing, and modest amounts of peroxide on the sub- and anti-jovian hemispheres. The results of this paper lead to a two-page highlight in the April 1, 2013 issue of Time magazine.
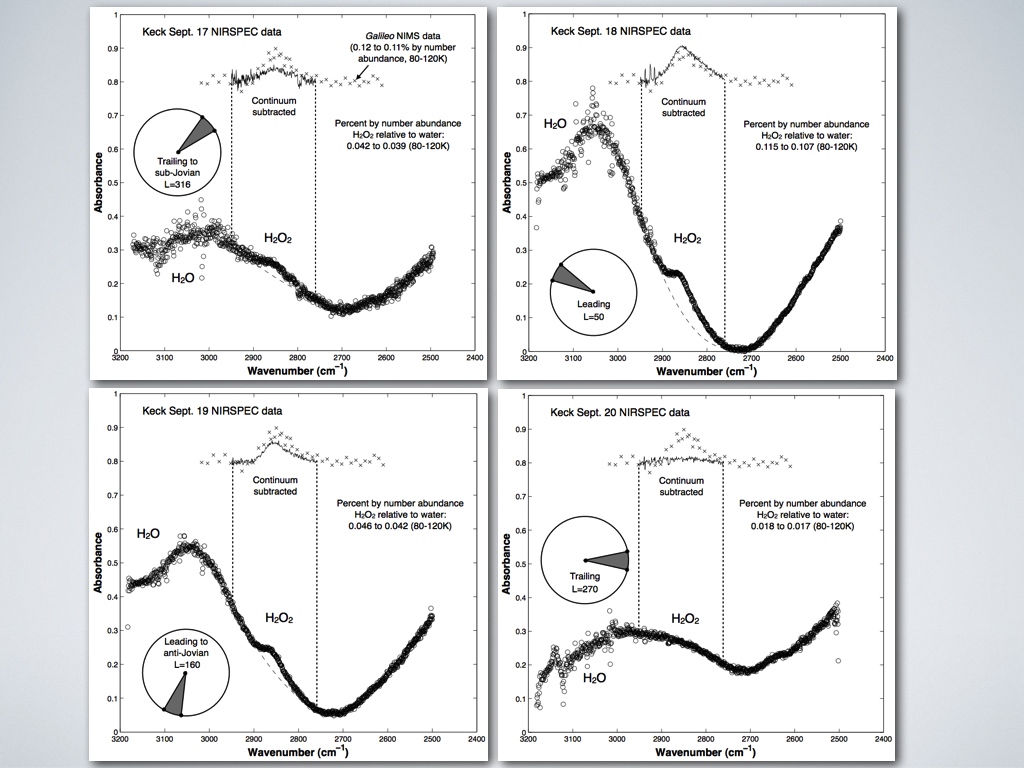
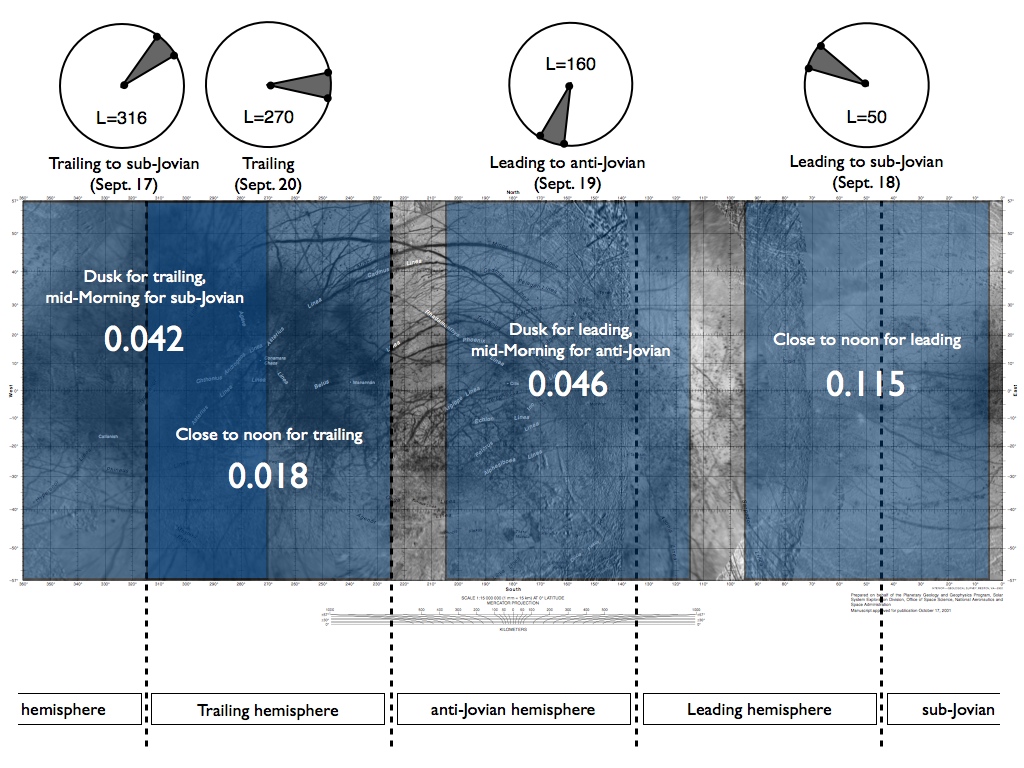
In our second paper (Hand & Brown, 2013), we presented the first global map and quantification of the hydrogen peroxide on the surface of Europa. We observed Europa over four consecutive nights using the Keck II near-infrared spectrograph (NIRSPEC). Spectra were collected in the 3.14-4.0 µm range, allowing detection and monitoring of the 3.5 µm feature due to hydrogen peroxide. Galileo Near-Infrared Spectrometer (NIMS) results revealed hydrogen peroxide on Europa in the anti-jovian region of the leading hemisphere at an abundance of 0.13+/-0.07% by number relative to water. We found comparable results for the two nights over which we observed the leading hemisphere, with reduced concentrations measured for observations that also incorporated sub- and anti-jovian hemispheres. Significantly, we also observed a small amount of hydrogen peroxide (~0.04%) during a night of observations of Europa’s trailing to sub-jovian hemispheres. No hydrogen peroxide was detected during observations of just the trailing hemisphere.
Part of Investigation 3 involves identification, characterization, and quantification of methane seeping lakes from the permafrost lakes of the Alaskan North Slope. Over the past year our team (Co-I’s Hand, Murray, and Priscu) have collected and analyzed both the methane concentration and isotopic signatures of 8 lakes during Fall and Spring field campaigns (partially funded by NAI, ASTEP, and JPL internal funds).
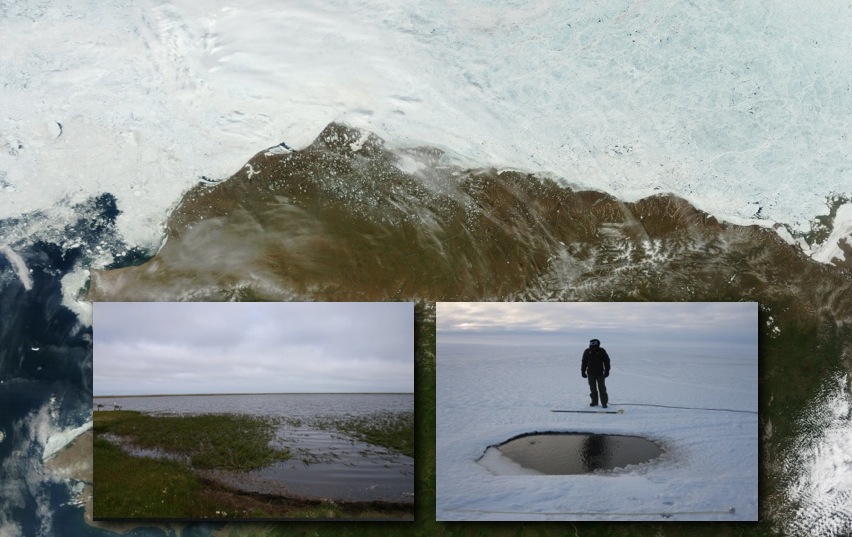
Figure 3-4 shows the North Slope region and the ~10,000 permafrost lakes.

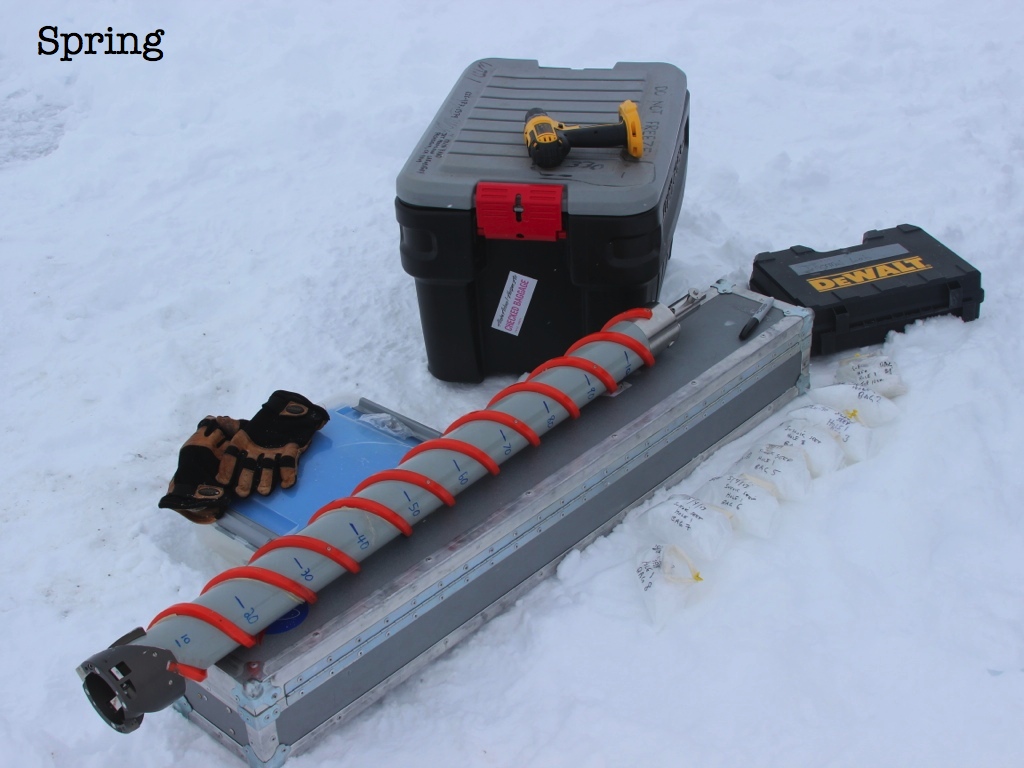
Figures 3-5 and 3-6 show in situ sampling during the Fall and then coring of the lake ice during spring. During the spring of 2013 the lake ice cores were extracted, measured in mass and volume, sliced into approximately 10-15 cm sections and then sealed in gas tight evacuated bags. The core subsections were then brought back to the lab facility in Barrow where we melted the ice and analyzed the gas in the headspace as shown in Fig. 3-7.

The methane and carbon dioxide concentrations were measured, as was the 13-C of the methane, using a Picarro gas analyzer. For each lake ice core depth profiles of these three parameters were constructed. Fig.3-8 shows the detail for the North Walakpa lake.

From the 13C signature on the methane we can begin to characterize the biogenic versus thermogenic/petrogenic origin of the lake methane. For instance, with the North Walakpa lake the -70 per mil signature of the methane at the bottom of the ice core is likely indicative of that methane source being modern biogenic – i.e. microbes in the sediment producing that methane. Interestingly, the correlated variations in methane, carbon dioxide, and methane 13C signature may indicate that some microbes are consuming methane witihin the ice shell during the winter months.
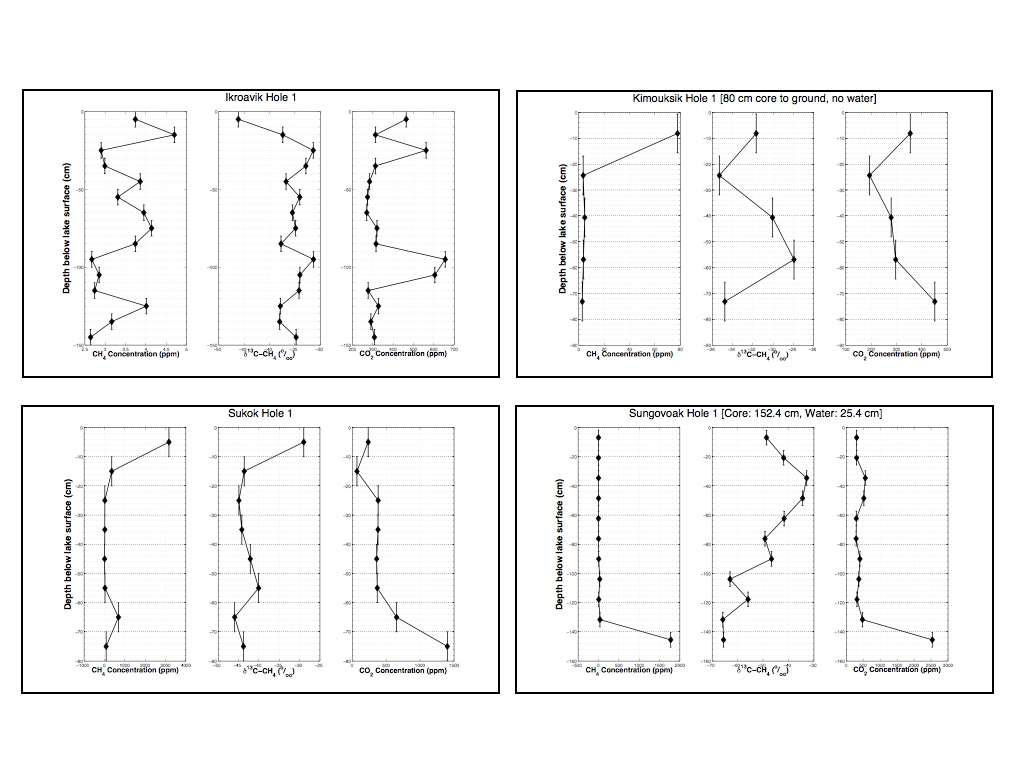
Shown in Fig. 3-9 are the profiles corresponding to four other lakes, some of which are biogenic and some of which are thermo/petrogenic. Commensurate with our ice core and gas sampling, our team analyzed the lake water profiles (during Fall and Spring) and took sediment cores from select lakes (during Fall). These samples are being analyzed to determine the character of the methane within the samples and to determine the active microbial populations within the sediments.
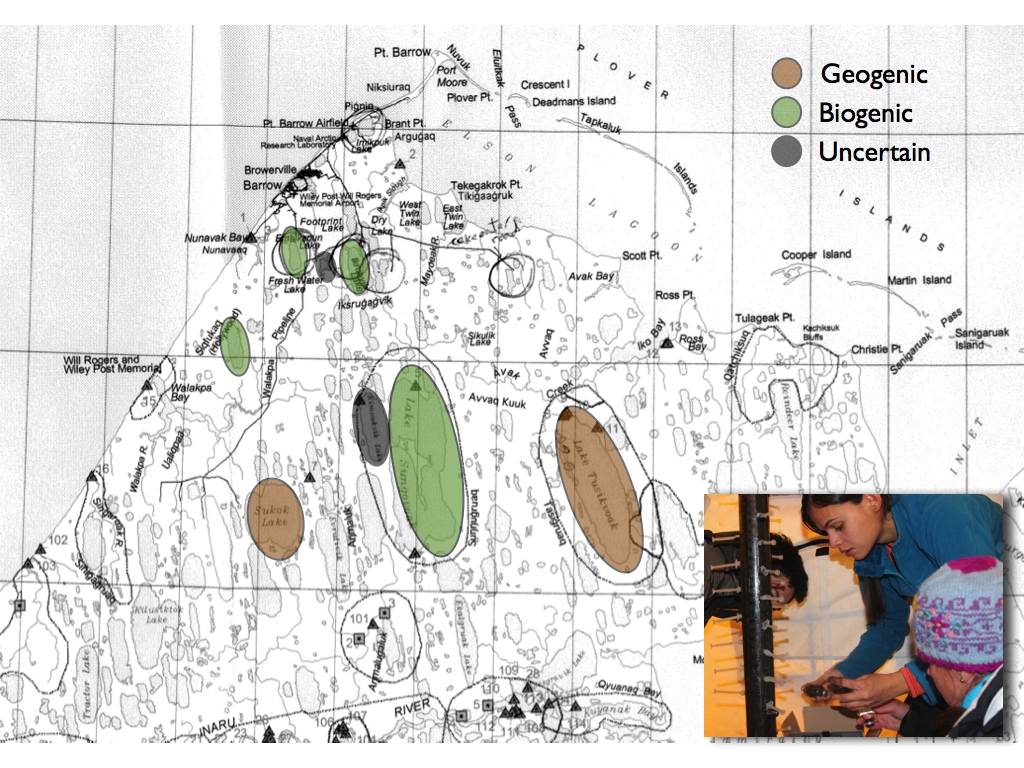
In Fig. 3-10 we show the sediment sampling along with our current map of the region with the lakes that we have sampled called out in different colors based on our in situ and lab measurements of the methane isotopic signature. This map is by no means conclusive in terms of the origin of the methane but it is a strong and compelling start toward better understanding the regional contribution of these methane sources. Significantly, many of the lakes we are analyzing were sampled at the GPS locations that correspond to sampling done by Phelps et al. (JGR, 1998) in the spring of 1996. Though that team did not analyzed the methane isotopic signature they did analyze the methane concentrations in the lakes. Given the 17 year baseline between their sampling and ours it is important to ask (and indeed this is part of our motivation) have these lakes changed over time, in terms of the methane concentrations seeping from the permafrost.
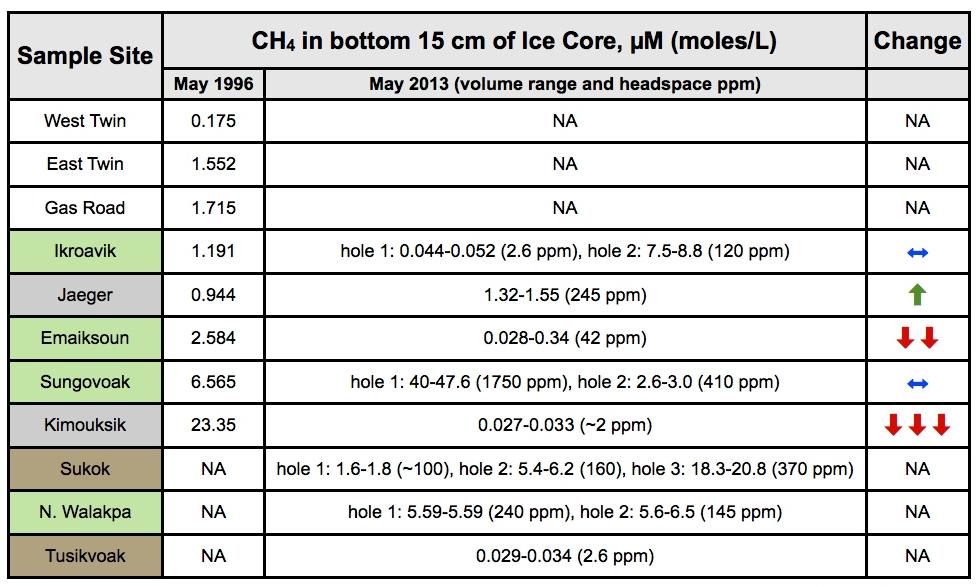
In Fig. 3-11 we show a table comparing the concentration measurements reported by Phelps et al. 1998 and our corresponding measurements from the spring of 2013. At present we see no systematic differences between the two series of measurements. It is not clear that the changes we see correspond to difference between biogenic or thermogenic methane seeping lakes. This is a significant comparison in light of terrestrial climate change because at least for this limited study we can show no bulk increase in emissions. A broader, more comprehensive – both in space and time – study is needed to truly address this question.
Co-I Alison Murray and her team investigated bacteria which live under very high levels of reduced metals, ammonia, molecular hydrogen, and dissolved organic carbon, as well as high concentrations of oxidized species of nitrogen (i.e., supersaturated nitrous oxide) and sulfur (as sulfate). The existence of this system, with active biota, and a suite of reduced as well as oxidized compounds, is highly unusual given the millennial scale of its isolation from external sources of energy. The geochemistry of the brine suggests that abiotic brine-rock reactions may occur in this system and that the rich sources of dissolved electron acceptors prevent sulfate reduction and methanogenesis from being energetically favorable. The discovery of this ecosystem and the in situ biotic and abiotic processes occurring at low temperature provides a tractable system to study habitability of isolated terrestrial cryoenvironments (e.g., permafrost cryopegs and subglacial ecosystems), and is a potential analog for habitats on other icy worlds where water-rock reactions may cooccur with saline deposits and subsurface oceans.
References:
Brown, M.E. and Hand, K.P. (2013) Salts and Radiation Products on the Surface of Europa. The Astronomical Journal, 145:4, 110, doi:10.1088/0004-6256/145/4/110
Hand, K.P. and Brown, M.E. (2013) Keck II Observations of Hemispherical Differences in H2O2 on Europa. The Astrophysical Journal Letters, 766:2, L21, doi:10.1088/2041-8205/766/2/L21.
Dalton, J. B. 2007, Geophys. Res. Lett., 34, L21205
Phelps, A. R., Peterson, K. M., Jeffries, M. O., Methane efflux from high-latitude lakes during spring ice melt, J. Geophys. Res.-Atmos., 103, D22, 29029-29036 (1998).
Publications
-
Brown, M. E., & Hand, K. P. (2013). SALTS AND RADIATION PRODUCTS ON THE SURFACE OF EUROPA. The Astronomical Journal, 145(4), 110. doi:10.1088/0004-6256/145/4/110
-
Hand, K. P., & Brown, M. E. (2013). KECK II OBSERVATIONS OF HEMISPHERICAL DIFFERENCES IN H 2 O 2 ON EUROPA. The Astrophysical Journal, 766(2), L21. doi:10.1088/2041-8205/766/2/l21
-
Marion, G. M., Murray, A. E., Wagner, B., Fritsen, C. H., Kenig, F., & Doran, P. T. (2013). Carbon Sequestration and Release from Antarctic Lakes: Lake Vida and West Lake Bonney (McMurdo Dry Valleys). Aquat Geochem, 19(2), 135–145. doi:10.1007/s10498-012-9184-1
-
Murray, A. E., Kenig, F., Fritsen, C. H., McKay, C. P., Cawley, K. M., Edwards, R., … Doran, P. T. (2012). Microbial life at -13 C in the brine of an ice-sealed Antarctic lake. Proceedings of the National Academy of Sciences, 109(50), 20626–20631. doi:10.1073/pnas.1208607109
-
PROJECT INVESTIGATORS:
-
PROJECT MEMBERS:
Kevin Hand
Project Investigator
Alison Murray
Co-Investigator
Adrian Ponce
Co-Investigator
John Priscu
Co-Investigator
Katey Walter
Co-Investigator
-
RELATED OBJECTIVES:
Objective 1.1
Formation and evolution of habitable planets.
Objective 2.2
Outer Solar System exploration
Objective 5.3
Biochemical adaptation to extreme environments
Objective 6.1
Effects of environmental changes on microbial ecosystems
Objective 6.2
Adaptation and evolution of life beyond Earth