2013 Annual Science Report
 Georgia Institute of Technology
Reporting | SEP 2012 – AUG 2013
Georgia Institute of Technology
Reporting | SEP 2012 – AUG 2013
RiboVision: Visualization and Analysis of Ribosomes
Project Summary
Ribosomes present special problems and opportunities related to visualization and analysis because they are exceeding complex and information-rich. Many structures have determined at near-atomic resolution, a large number of rRNAs have been sequenced, and each is a large macromolecular assembly with many components and highly complex function. We are devising visualization and analysis methods in analogy with Google Maps, but applied to the ribosome. We have used these tools to make important discoveries relevant to ribosomal structure, function and origins.
Project Progress
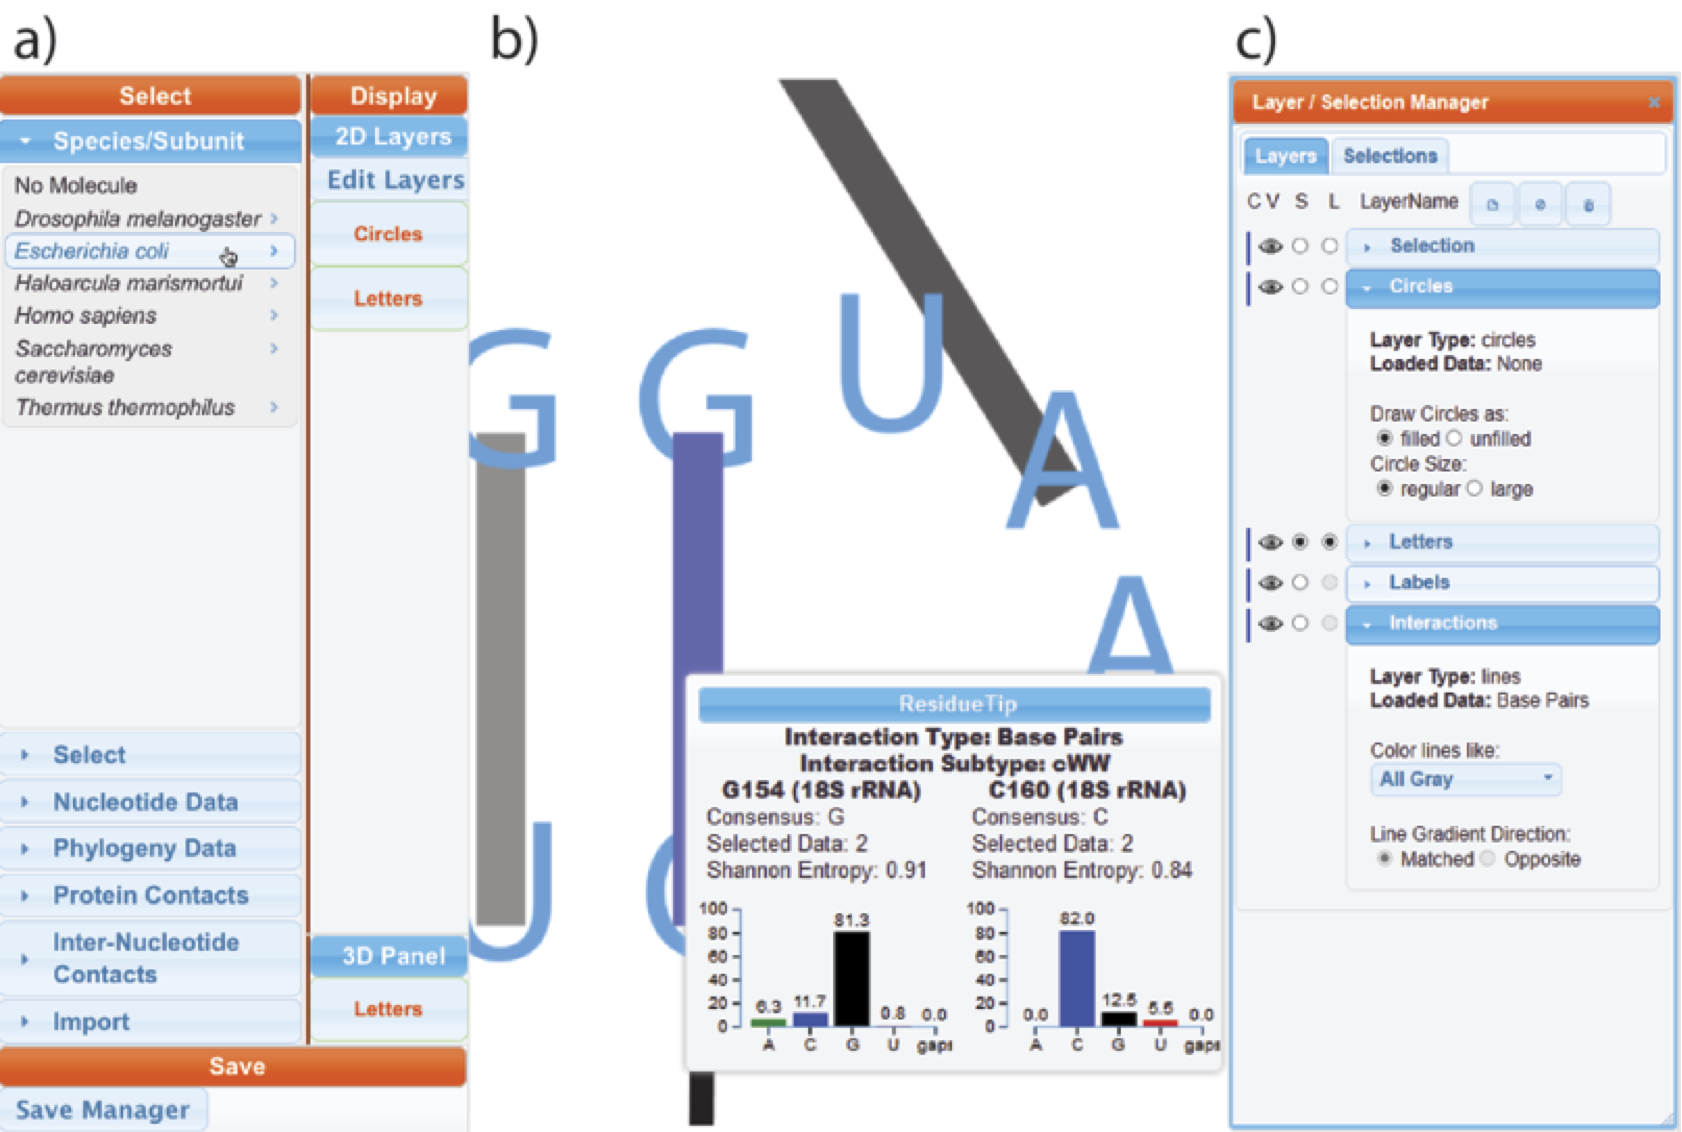
The RiboEvo team is in the process of developing and applying ‘RiboVision,’ a visualization and analysis tool for simultaneous display of multiple layers of information on primary (1D), secondary (2D), and three-dimensional (3D) representations of ribosomes. RiboVision allows users to easily import and analyze their own data in the context of other work, and to quickly generate publication-quality images of the results. RiboVision has features in rough analogy with Google Maps, Google Earth and Street View, designed for the “Ribosome World.” A long-term goal is to extend this work to support a variety of large macromolecular, geological and astronomical assemblies. Ribovision is available at http://apollo.chemistry.gatech.edu/public/RiboVision.
The ribosome is found in every living cell, and is responsible for translation of genetic information from messenger RNA to coded protein. Ribosomes present special problems and opportunities related to visualization and analysis. Ribosomes are information-rich in that many structures are determined at near-atomic resolution, and each is a large macromolecular assembly with many components and highly complex function. Each ribosome consists of several large ribosomal RNA molecules, over fifty ribosomal proteins, and a large number of cations. A ribosome contains over 300,000 atoms. The structure and function of a ribosome is understood only by consideration of a wide variety of information. Visualization of ribosomes, comparison of sequences, and the mapping of information between dimensions have been cumbersome processes that often required multiple specialized computer tools and manual intervention.
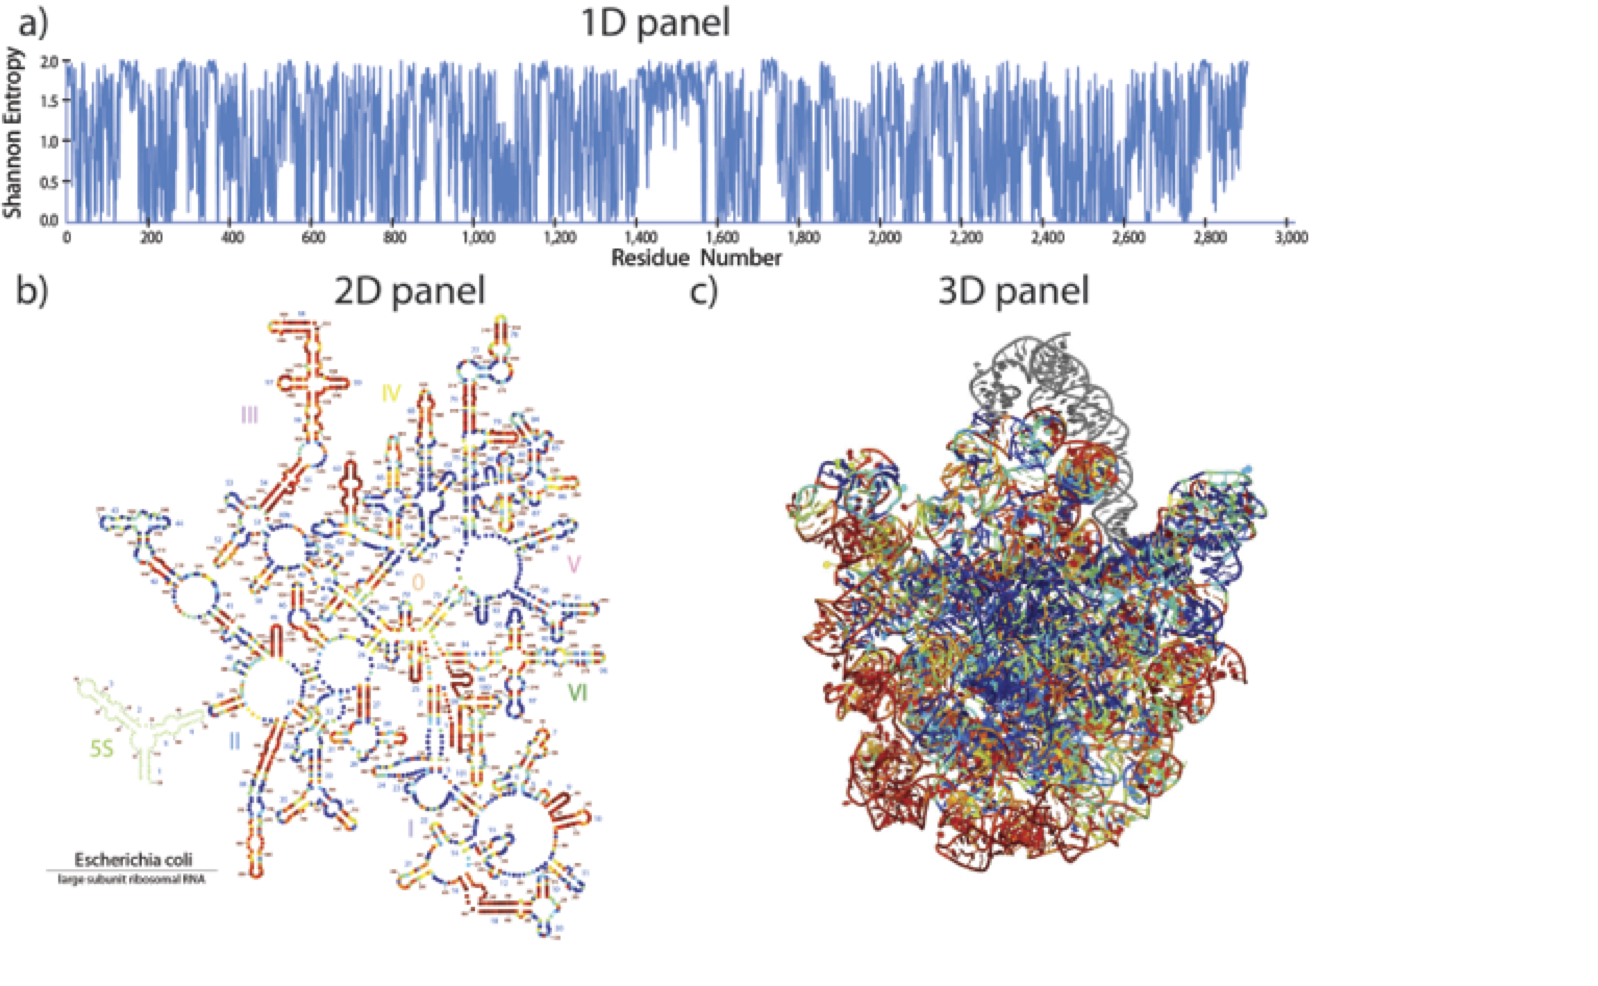
RiboVision is a visualization and analysis tool for simultaneous display of multiple layers of diverse information on primary (1D), secondary (2D), and three-dimensional (3D) structures of ribosomes. RiboVision is intended for rapid retrieval, analysis, filtering, and display of a variety of ribosomal data. Preloaded information includes 1D, 2D, and 3D structures augmented by base-pairing, base-stacking and other molecular interactions. RiboVision is preloaded with rRNA secondary structures, rRNA domains and helical structures, phylogeny, crystallographic thermal factors, etc. RiboVision contains structures of ribosomal proteins and a database of their molecular interactions with rRNA. RiboVision contains pre-loaded structures and data for two bacterial ribosomes (Thermus thermophilus and Escherichia coli), one archaeal ribosome (Haloarcula marismortui), and three eukaryotic ribosomes (Saccharomyces cerevisiae, Drosophila melanogaster, and Homo sapiens). RiboVision revealed several major discrepancies between 2D and 3D structures of 16S/18S and 23S/28S rRNAs. Revised structures mapped with the variety of data are available in RiboVision as well as in a public gallery (http://apollo.chemistry.gatech.edu/RibosomeGallery. RiboVision is designed to allow users to distill complex data quickly and to easily generate publication-quality images of data mapped onto secondary structures. Users can readily import and analyze their own data in the context of other work. This package allows users to import data from simple CSV format files and to map it directly onto 1D, 2D, and 3D levels of structure. RiboVision has features in rough analogy with web-based map services capable of seamlessly switching the type of data displayed and the resolution or magnification of the display. RiboVision is available at http://apollo.chemistry.gatech.edu/RiboVision.
Accurate secondary structures are important for understanding ribosomes. Using RiboVision and 3D structures of ribosomes as input, we have constructed de novo 2° structures of rRNAs. We identify helices by specific geometric and molecular interaction criteria, not by co-variation. The structural approach allows us to incorporate non-canonical base pairs on parity with Watson-Crick base pairs rather than by post hoc adjustment or symbolic notation. The resulting rRNA 2° structures are up-to-date and consistent with three-dimensional structures, and are information-rich. These 2° structures are relatively simple to understand and are amenable to reproduction and modification by end-users. The 2° structures broadly sample the phylogenetic tree and are mapped with a variety of data related to molecular interactions and geometry, phylogeny and evolution. We have generated 2° structures for both 23S/28S and 16S/18S rRNAs of Escherichia coli, Thermus thermophilus, Haloarula marismortui (LSU rRNA only), Saccharomyces cerevisiae, Drosophilia melanogaster and Homo sapiens. We provide high-resolution editable versions of the 2° structures in several file formats. Both LSU and SSU secondary maps are available (apollo.chemistry.gatech.edu/RibosomeGallery).
In the traditional 2° structure, the center of the 23S rRNA is an extended single-stranded region, which in three-dimensions is seen to be compact and double helical. Accurately assigning nucleotides to helices compels a revision of the 23S rRNA 2° structure. Unlike the traditional 2° structure, the revised 2° structure of the 23S rRNA shows architectural similarity with the 16S rRNA. The revised 2° structure also reveals a clear relationship with the three-dimensional structure and is generalizable to rRNAs of other species from all three domains of life. The 2° structure revision required us reconsider the domain architecture. We partitioned the 23S rRNA into domains through analysis of molecular interactions, calculations of 2D folding propensities, and compactness. The best domain model for the 23S rRNA contains seven domains, not six as previously assumed. A proposed Domain 0 forms the core of the 23S rRNA, to which the other six domains are rooted.
-
PROJECT INVESTIGATORS:
-
PROJECT MEMBERS:
Chad Bernier
Collaborator
Jessica Bowman
Collaborator
Larry Freil
Collaborator
Eli Hershkovits
Collaborator
Chiaolong Hsiao
Collaborator
James Jett
Collaborator
Ai Le
Collaborator
Fengbo Li
Collaborator
Blacki Milhose
Collaborator
Anton Petrov
Collaborator
Lan Wang
Collaborator
Chris Waterbury
Collaborator
Xiao Xiong
Collaborator
Yuzhen Xue
Collaborator
-
RELATED OBJECTIVES:
Objective 3.2
Origins and evolution of functional biomolecules
Objective 4.2
Production of complex life.


