2012 Annual Science Report
 NASA Jet Propulsion Laboratory - Titan
Reporting | SEP 2011 – AUG 2012
NASA Jet Propulsion Laboratory - Titan
Reporting | SEP 2011 – AUG 2012
Task 2.1.1.1 Master Atmospheric Chemistry Simulation
Project Summary
A new approach to the condensation of molecules onto grains and sublimation back to the gas has been implemented to account for these processes in an approach that is numerically stable and relies on the extensive database of laboratory data on the saturation vapor pressures of molecules. This, combined with the new description of grain size distribution (implemented last year), will provide a great improvement in the description of the organic chemistry in Titan’s atmosphere.
Project Progress
Colleague Karen Willacy and Principal Investigator Mark Allen updated the KINETICS code, on which the Titan atmospheric model is built, to include a more sophisticated description of atmospheric sublimation and condensation processes on Titan aerosols. Condensation occurs when the vapor pressure of a molecule exceeds its saturation vapor pressure for that temperature. Traditionally the planetary atmospheres and interstellar chemistry communities have used different approaches with different strengths and weaknesses. The aim was to combine the best features of both to provide a better approach. The planetary atmospheres models usually are based on saturation vapor pressure data, but have the drawback of not providing a smooth transition between condensation and sublimation dominated regimes, resulting in numerical instabilities. Interstellar models include specific reactions for sublimation and condensation and hence are numerically stable, but rely on the binding energy of the molecule to the grain surface to provide the sublimation rate. This binding energy has been measured for only a handful of molecules, and hence this method relies on estimates of its magnitude.
The aim was to use the advantages of both methods to develop a new approach that would be both numerically stable, and based on experimentally determined saturation vapor pressures. When the gas is saturated, condensation and sublimation are in equilibrium.
Where kf is the freezeout rate coefficient, n~[sat~](X) is the density at which the gas saturates (determined from the saturation vapor pressure), kd is the desorption flux from the grain surface (cm-2s-1) , 4σ is the surface area of the grains, ng the number of grains, and ΘX is the surface coverage of molecule X.
If we assume that the freezeout rate is the rate at which molecules collide with grains i.e.
Where SX is the sticking coefficient (assumed here to be 1), vX is the gas phase velocity of X, then we can determine kd:
The saturation vapor pressures are measured over pure ice or liquid so ΘX = 1 and kd depends only on the saturated density, the velocity of the gas phase molecule and the surface coverage.
We have tested this approach in a simple point chemical model and are now incorporating it into the larger KINETICS model. Figure 1(left) illustrates some of the results. As expected, the new approach reproduces the saturation vapor data for the case of a pure ice. However for mixed ices, there are differences, caused by the reduction in the surface coverage, ΘX. In each case the proportion of the molecules in the surface layer that desorb is the same, but because there are fewer molecules of X in the surface layer the number that sublimate is reduced. The sublimation rate is proportional to the surface coverage (Figure 1 (right)). This represents an improvement over the previous vapor pressure-based models which always assumed desorption at the pure ice rate.
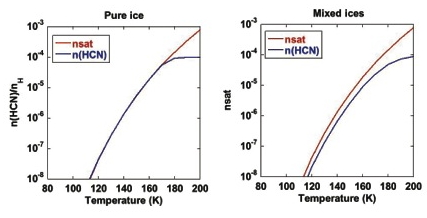
Figure 1: The calculated gas phase abundances using our new method of determining sublimation rates. On the left is the pure ice case, where the calculated abundance of HCN (blue line) follows the saturated abundance (red line) determined from the saturated vapor pressure. The flattening off of the blue cure at ~ 170 K is due to n(HCN) reaching the maximum abundance possible in this model. The right hand plot shows n(HCN) (blue line) for the case of mixed ices. The mixed ice consists of 50% HCN and 50% H2O. In this case the surface density is lower than in the pure ice case and the rate at which molecules are returned to the gas is reduced. Hence n(HCN) never reaches the saturated value.
-
PROJECT INVESTIGATORS:
-
PROJECT MEMBERS:
Karen Willacy
Research Staff
-
RELATED OBJECTIVES:
Objective 2.2
Outer Solar System exploration
Objective 3.1
Sources of prebiotic materials and catalysts
