2012 Annual Science Report
 NASA Goddard Space Flight Center
Reporting | SEP 2011 – AUG 2012
NASA Goddard Space Flight Center
Reporting | SEP 2011 – AUG 2012
Progress Report From G. Blake - CIT
Project Summary
The Blake group has been carrying out joint observational and laboratory program with NAI node scientists on the water and simple organic chemistry in the protoplanetary disk analogs of the solar nebula and in comets. Scientific results continue to flow at a rapid clip. We have followed up our major overview papers outlining the results from our extensive (>100 disks) Spitzer IRS survey of the molecular emission from the terrestrial planet forming region with follow-up work with GSFC scientists on the high spectral resolution ground-based observations of such emission and that from cometary comae (and possible non-transiting exoplanets) using the Keck telescope and the VLT. We have measured the angular scale of the disk emission, and discovered a new transitional disk class characterized by a wide angle molecular wind. We have probed the outer disk’s water emission with the Herschel HIFI instrument, and also measured the (D/H)water ratio in a Jupiter Family Comet for the first time with Herschel – finding a value consistent with that in the Earth’s oceans. Our first Cycle 0 ALMA data are now in hand, and beautifully demonstrate the high angular resolution observations of simple organics in the outer regions of disks and comets that will become possible over the coming years. The full suite of results will permit the first detailed examination of the radial water and gas phase organic chemistry in planet-forming environments.
Project Progress
Scienfitic Background: As part of the overall Astrobiology Node at the NASA Goddard Space Flight Center, whose goal is an understanding of the Origin and Evolution of Organics in Planetary Systems (Mike Mumma, P.I.), Co-Investigator Blake is directing both laboratory and astronomical spectroscopy programs. The goal of these observations is to determine whether complex organics are detectable in the circumstellar accretion disks that encircle young stars and in the comae of comets. Ultimately we also hope to tie the composition of extrasolar planetary atmsopheres to the conditions under which the planetary system was assembled.
By acting as conduits for mass and angular momentum transport, circumstellar disks provide the pivotal observational link between star formation and (exo)planetary science. The disk internal structure is particularly important for planet formation and evolution, but is difficult to image directly (Dullemond et al. 2006). Thanks to the strong temperature/density gradients in disks, volatile compounds will condense at different locations. For example, in the solar nebula the “snowline” (water ice) appeared near 3–5 AU, while CO frosts are only stable where Tdust ∼ 20 K.
Thus, the predictions are that the major disk molecules, at all radii, are H2 and CO; but that the gas phase abundances for other species are strong functions of radius and height. The major condensable, H2O, exerts a dominant influence on the carbon chemistry (Boonman et al. 2000), and is transported outward as vapor from the inner disk (Stevenson & Lunine 1988); icy bodies drift inward (Ciesla & Cuzzi 2006). The gas composition should thus be sensitive to disk transport processes. Further, rocky planets are largely stripped of water by accretional heat and (giant) impacts, and one of the key questions as to our origins is thus how water and other volatiles were transported from the outer solar nebula into the terrestrial planet-forming zone and eventually to the surface of the early Earth.
2. Observational Effort: Observations of water vapor and the simple but rather less abundant precursors to complex organics (HCN, C2H2, CH4) in extrasolar planets, and in circumstellar disks undergoing planetary system formation, would be instrumental in testing the scenario outlined in §1. Both water and methane have now been seen in the extrasolar planet HD189733b (Swain etal. 2008); and while H2O has been detected in vast quantities in molecular clouds and protostellar envelopes (Boogert et al. 2004, Watson et al. 2007), there are only a handful of reported ice (Terada et al. 2007) and vapor (Shiba et al. 1993, Carr et al. 2004, Eisner 2007) spectra toward pre-main sequence stars.
We have therefore been testing the expectations concerning the physico-chemical evolution of proto planetary disks for some time, through extensive high resolution IR and far-IR spectroscopic surveys of the molecular content of disks and comets. Our ongoing NIRSPEC M-band spectroscopic survey has confirmed that CO is indeed a widespread tracer in classical (Blake & Boogert 2004) and transitional (Salyk et al. 2007, 2009) disks. Spectro-astrometric observations of the CO v=1→0 band (with CRIRES at the VLT) have confirmed the expected Keplerian velocity fields and “imaged” the disk gas down to scales of <0.1 AU in many disks (Pontoppidan et al. 2008), but have also revealed unexpected non-Keplerian (radial velocity) signatures in a substantial suite of protoplanetary disks that we have recently been shown to be consistent with a wide angle disk wind (Pontoppidan et al. 2011). As we show next, the combination of Spitzer-IRS, Keck/VLT/Gemini and Herschel/ CARMA/ALMA observations has been highly successful at detecting water vapor and volatile organics in the disks around classical T Tauri stars (cTTs). This critical step forward clearly holds the promise of more detailed studies involving statistically significant samples, which forms the basis of our observational research supported by the GSFC Astrobiology Node.
Spitzer/Keck/VLT Program: By pushing the dynamic range of the Spitzer-IRS to its limits as part of the “Cores to Disks” Legacy program (c2d, Evans etal. 2003) we were among the first to detect water vapor and organics from both nearly edge-on (via absorption, Lahuis et al. 2006) and inclined disks (via emission, Salyk et al. 2008, see also Carr & Najita 2008 and Furlan et al. 2006). The emission lines from water, CO2, HCN, and C2H2 are at the few percent line:continuum level, as shown in Figure 1. Toward the end of the cryogenic Spitzer mission we joined forces with J.Carr and J.Najita as part of a ∼60 hour Priority 1 Spitzer GO-5 medium program to capitalize on these developments and lay the foundation for studies of the physical and chemical state of the gas – the dominant reservoir of disk matter – at planet formation distances (PID#50641, J. Carr, P.I.).
At λ/Δλ=600, the water+organics emission lines suffer from severe line blending across the full SH+LH wavelength span. In Fig. 1 we present expanded versions of the data for several Taurus sources and AS205, along with LTE models(re-sampled toR=600). Because well defined predictions of disk chemistry versus perturbations in evolutionary state are not (yet) available, the IRS GO-5 program deliberately spanned a range in disk settling, accretion rate, and X-ray luminosity. The first two quantities may serve as rough indicators of evolutionary “age,” and the full GO-5 cTTs sample covered a much larger range in each of the chosen disk characteristics than have been examined to date. To this data set we have added archival spectra from the c2d and GTO programs to examine the molecular content of disk surfaces as a function of stellar type (mass). Interestingly, we have found that the majority of cTTs disks display water and simple organic emission lines, while the spectra of Herbig Ae stars and transitional disks display little/no emission across the Spitzer passband (see Figure 2) – but are strong emitters in the CO Δ =1 bands near 4.7 µm. Early in this NAI program we completed our (first order) analysis of these data and presented our findings in two significant Ap. J. manuscripts (Pontoppidan et al. 2010a, Salyk et al. 2011).
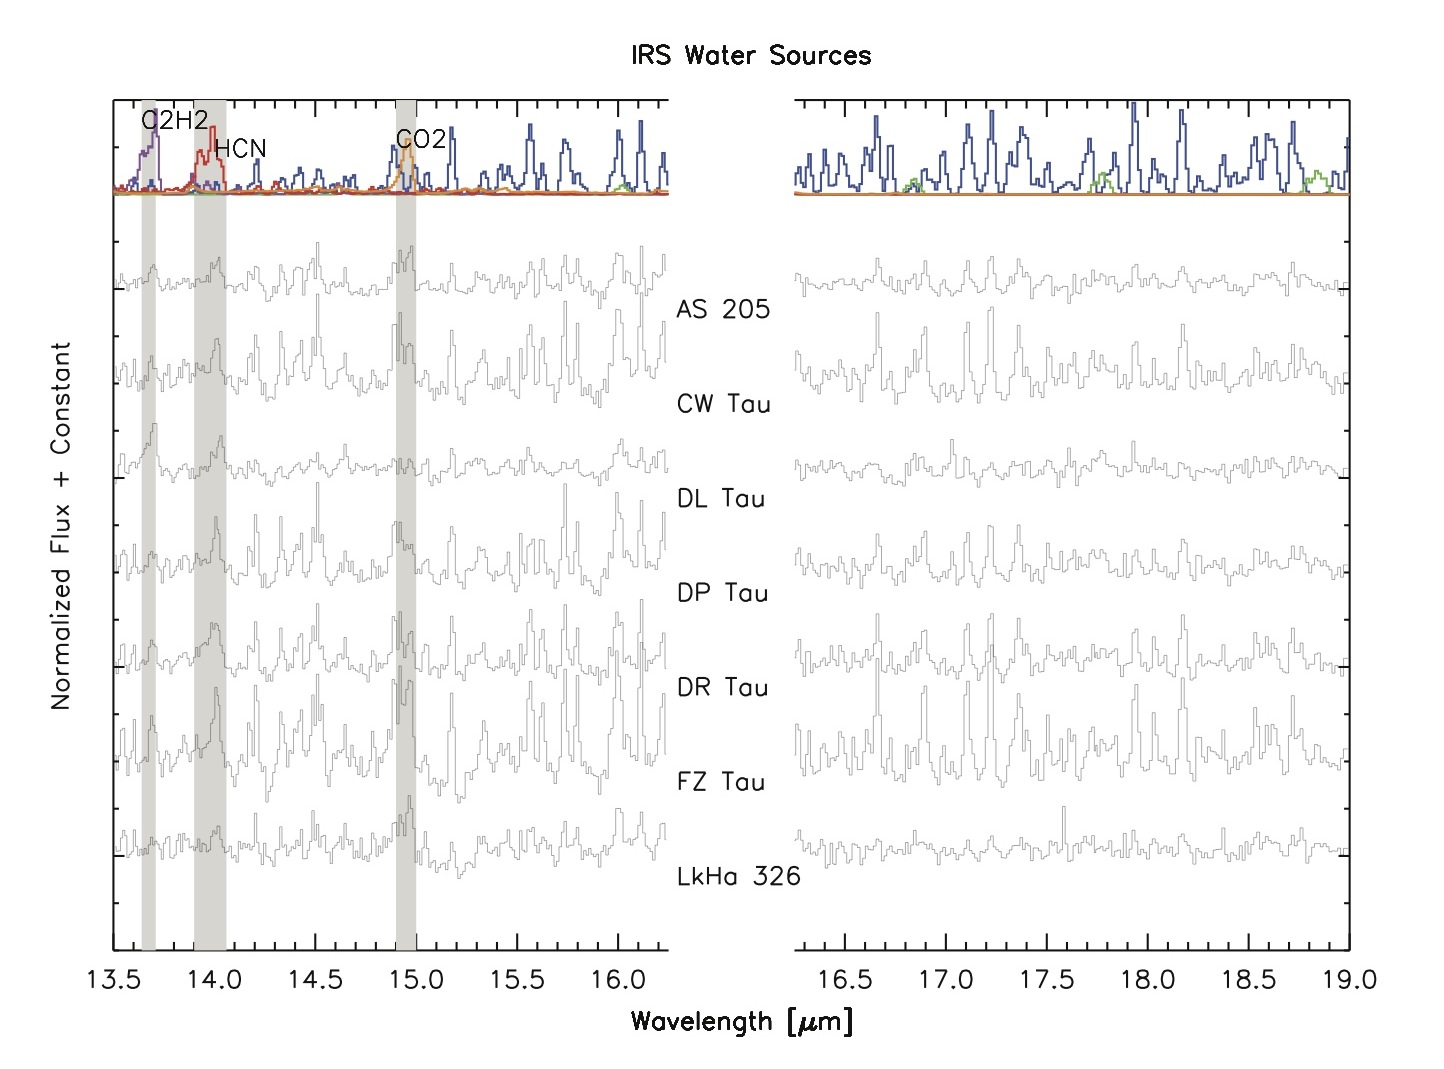
Figure 1. (Left) The 13.5-19.0 µm portion of the Spitzer-IRS spectra of several Perseus/Taurus circumstellar disk sources obtained in the GO-5 program along with AS205N and DR Tau (Salyk et al. 2008). Atop the data LTE models of H2O, OH, CO2 , HCN, and C2H2 emission at ∼800 K are displayed. Broad features, such as the silicate 10 and 18 µm bands, have been removed with spline fits to the original data to highlight the molecular emission. The line:continuum excess of the strongest emitters (CW Tau, FZ Tau) is ∼ 10%.
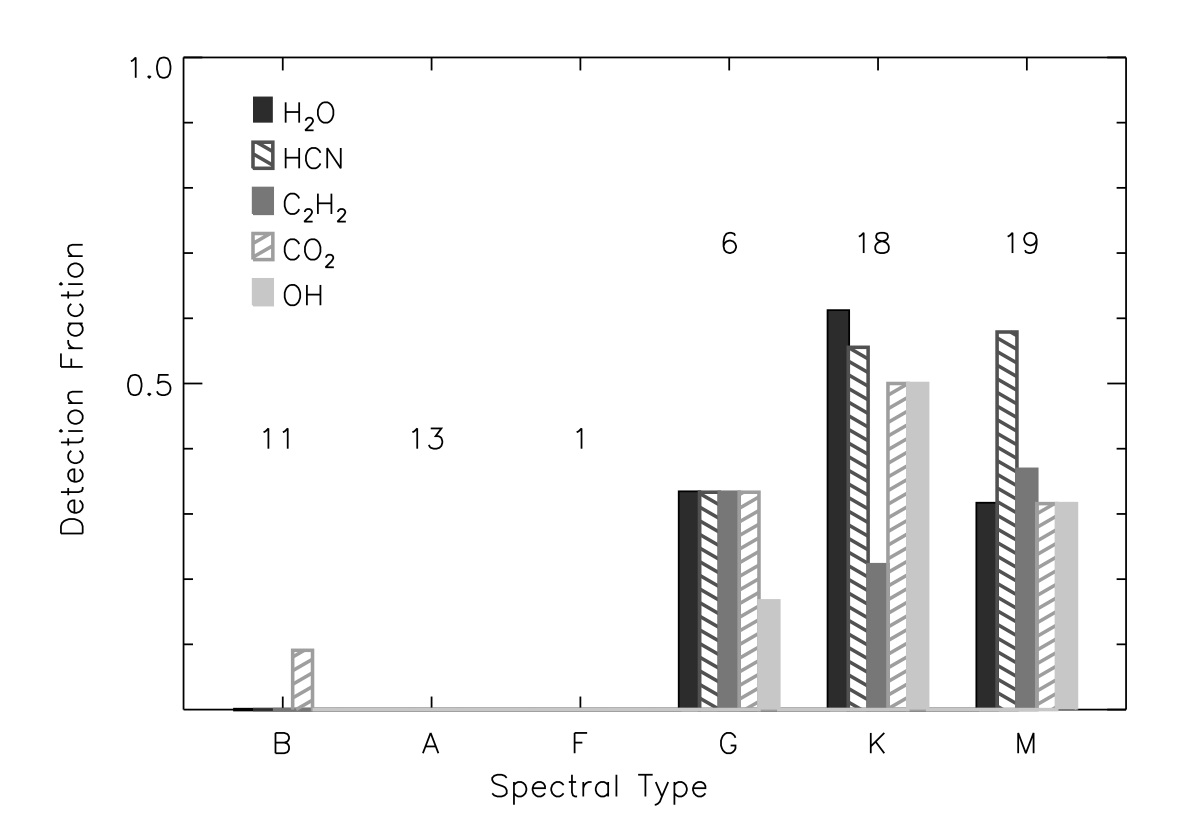
Figure 2. (Right) The Spitzer detection rate as a function of spectral type for the strongest infrared molecular tracers, with the number of each spectral type shown above.
At the Spitzer IRS resolution the origin of the emission can only be crudely estimated, and so high spectral resolution follow-up observations are essential to measure the line profiles and thus determine
the emitting radius (Salyk et al. 2008, Mandell et al. 2008). We have recently developed highly efficient statistical equilibrium radiative transfer models of disks that can be used to simulate the full spectral energy distribution at high spectral and spatial resolution (Pontoppidan et al. 2009), and present in Figure 3 a simulated SED/spectrum for the AA Tau disk. Nearly all of the GO-5 targets are too faint for direct 10-20 µm ground-based spectroscopic studies, even with 10m-class telescopes, but we have managed to detect 12 µm water emission lines from two of the brightest disks in Ophiuchus with VLT-VISIR (Pontoppidan et al. 2010b), and recent observations with Gemini-MICHELLE (January 2011, 2012) have provided additional detections in four disks in Taurus. Thankfully, as Fig. 4 shows NIRSPEC L-band R=25,000 set ups can also detect and resolve H2O/OH lines in disks, and the longer wavelength orders (3.0-3.4 µm) provide access to the C–H stretch mode of organics such as HCN/C2H2 and CH4 (shown in Fig. 3). This work is being led by Dr. Avi Mandell at GSFC, and relies on high precision atmospheric fitting routines that enable nearly shot noise-limited L-band observations (Mandell et al. 2012).
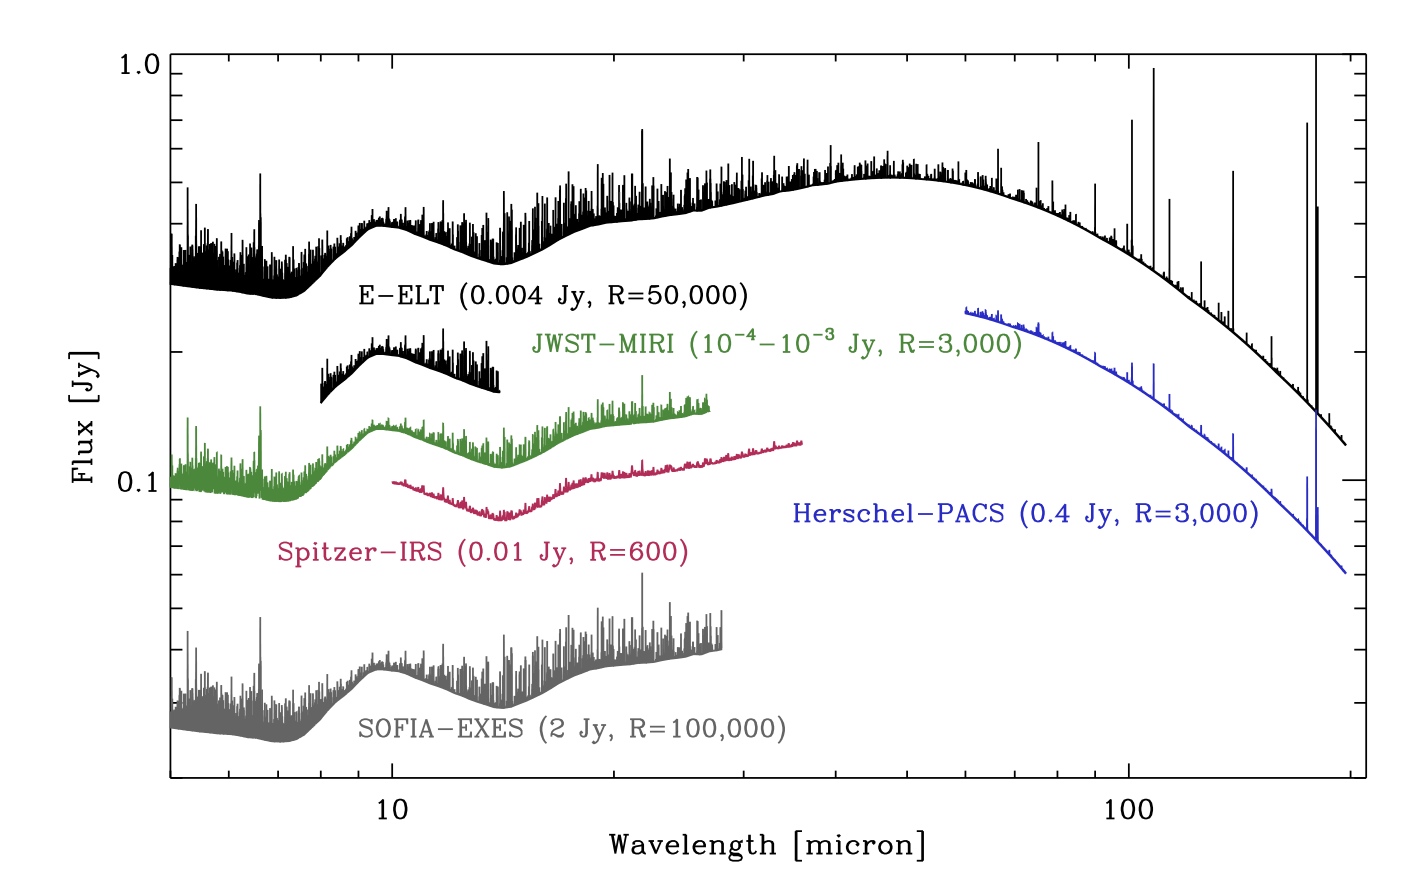
Figure 3. (Left) A full range calculation of the IR water spectrum from a typical protoplanetary disk. In addition, scaled (for clarity) model spectra convolved to the spectral resolution of various observatories are shown, along with their rough sensitivities (10σ/1 hr) and spectral resolving powers.
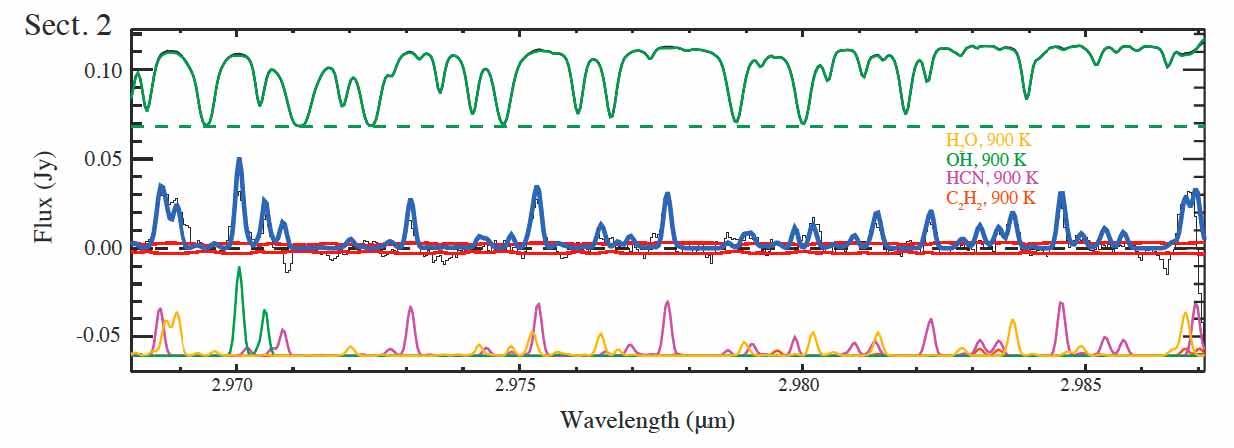
Figure 4. High dynamic range NIRSPEC L-band data for the classical T Tauri star DR Tau. Features of water, OH, and HCN are clearly visible, the detection of acetylene requires stacking of all of the P- and R-branch features in the multi-order échelle data (not shown here, figure adapted from Mandell et al. 2012).
Since the water and CO line profiles are quite similar at the velocity resolution of NIRSPEC, we use combined fits to estimate the water/OH emission temperature and column density (from the weakest lines), inner emitting radii (0.5-1AU), and emitting area (from CO). Provided the system is not oriented face-on, kinematics can be extracted out to ∼10-20 AU, and the water line profiles should be sensitive to the location of the “snow line” (Meijerinket al. 2009). With all of the GO-5 data in hand, the HCN and C2H2 abundances appear to be significantly enhanced in the inner disk (Salyk et al. 2011, see also Lahuis et al. 2006, Carr & Najita 2008), and significantly correlated with the water abundance. To further answer questions questions concerning disk transport mechanisms, dust processing, and disk evaporation (Acke et al. 2005, Alexander et al. 2006), the radial and vertical distribution of the water vapor, OH, and simple organics must be determined. Accordingly, we are using support from the Astrobiology program to complete the L-band survey that concentrates on the GO-5 Spitzer-IRS sources. The Keck/NIRSPEC echelle is being used for sources in Perseus and Taurus, VLT/CRIRES for sources in Ophiuchus and Chameleon. For the very brightest targets, extremely high dynamic range observations are needed, and for this purpose we are continuing our collaborative work with the Mumma group on the analysis of high SNR data with routines developed at NASA GSFC. These codes should also have applications to the high SNR spectroscopy of extrasolar planetary transits and secondary eclipses. A first dataset/analysis on HD 189733b has been published (Mandell etal. 2011), and Dr. Mandell is presently hard at work on the data reduction for Keck observations of the transits of the super-Earth GJ 1214b, which must take extraordinary care of potential systematic artifacts in the data. If successful, such R=25,000 spectra of extrasolar planet atmospheres will be of great interest to other NAI teams.
With extensive natural seeing data now largely in hand, we have also begun to investigate the spectro-astrometric and time domain capabilities of NIRSPEC at L- and M-band – now possible thanks to filter and pupil stop revisions to this instrument. Although the raw counts/sec drops by a factor of ∼ten compared to natural seeing-limited NIRSPEC data, and even with some seventeen warm mirrors between the instrument and sky, the M-band source/sky emission line contrast is markedly improved in NIRSPEC-AO mode thanks to the cold pupil stop and smaller solid angle of sky imaged by each pixel. Importantly, the drop in background is sufficient to enable multiple reads of the detector, which substantially offsets the drop in throughput. The longer integration times also drop the number of co-adds, which lowers the fixed pattern (read) noise. Nodding along the slit is quite accurate (to within 1-2 pixels once the loops are closed).
To generate spectra, curvature in the 2D echellograms is first removed and an accurate wavelength scale derived from the numerous sky lines. Then, Spectro-Astrometry (SA) signatures are obtained by measuring the centroid of the emission versus wavelength. A comparison of the spectra and SA signatures acquired in NIRSPEC-AO (14Dec2010, 19 min. of integration) and NIRSEPC (17 Dec 2010, 18 min. of integration) modes at comparable airmasses and natural seeing of <0.”7 are shown in Figure 5. To remove atmospheric and instrumental artifacts, SA signatures are best obtained by paired spectra with a selected slit PA and PA±180°. In natural seeing, constant PA mode, the NIRSPEC image rotator is found to introduce significant and time variable background at M band that precludes SA observations for all but a select range of PAs. The AO image rotator showed no such structure over the three nights. From the data presented in Figure 5, we measure a dynamic range on the continuum (for velocity windows of ±40-150 km/s) of 188 in the AO-mode, and 121 for non-AO mode observations. Over the same velocity range, the standard deviation for the SA signal is 140 µas for AO observations, and 760 µas for the non-AO data. Similar results are found at L-band. Importantly, the cross dispersed nature of NIRSPEC enables many more lines of water and OH to be obtained as compared to CRIRES, and for simultaneous observations of water and organics. As such, future SA observations with NIRSPEC are presently our highest observational priority.
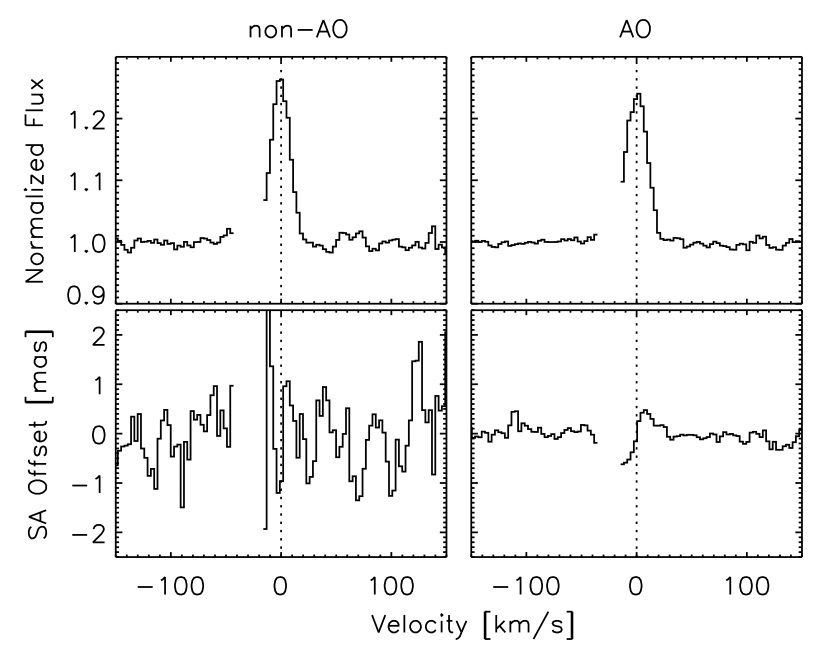
Figure 5. – Comparison of NIRSPEC CO M-band spectra from the transitional disk LkHα 330 (top) along with the Spectro-Astrometric (SA) signature in natural seeing(left) and NGS mode (right). Seven CO lines are stacked to produce the spectra (Salyk et al. 2009), and regions with <70% atmospheric transmission are masked. To process the SA data (see Pontoppidan et al. 2008 for a detailed description of SA observing procedures and data analysis), spectra were acquired at slit position angles (PAs) of 165° and 345°. The Keplerian signature from gas in the inner regions of the disk is clearly detected in the AO observations.
Interestingly, in analyses of systems with fairly substantial accretion rates we see line profiles that are not consistent with Keplerian dynamics unless the disk is essentially face-on. As Figure 6 outlines, the SA data are most consistent with a broad angle, low-velocity disk wind as the source of this compact, narrow velocity component. Such a wind would be capable of transporting both small dust grains and molecular gas that has been processed through a high temperature environment, unlike X-wind models. Such effects may explain long puzzling signatures in the icy composition of comets and other primitive bodies, and so we are following up these first set of measurements and LTE models with more detailed radiative transfer simulations of Keplerian disk+angular momentum conserving wind systems.

Figure 6.– Sketch of a disk wind model qualitatively reproducing broad single-peaked CO line spectra and CRIRES spectro-astrometry from highly accreting T Tauri stars (in this example, AS 205, a T Tauri star in Ophiuchus). The left panels show the observed CO rovibrational (v=1–0 near 4.7 μm) line spectrum and spectro-astrometry at 3 different slit position angles. The middle panels show two 2D radiative transfer models: one for a purely Keplerian disk, and one for a Keplerian disk in which a wide-angle molecular wind is launched from the disk surface. The wind model reproduces the strong single-peaked line with broad wings as well as the strong asymmetry along the disk minor axis seen in the spectro-astrometry. The sketch on the right panel indicates that the disk is viewed close to face-on. Adapted from Pontoppidan et al. (2011).
What is perhaps most surprising and distinctive about these newly discovered disk winds is that they are highly molecular, showing not just CO but also HCN and H2O (Mandell et al. 2012). The infrared observations, while powerful, cannot constrain the ultimate fate of the wind. This requires observations of low excitation/low density tracers, and so we have begun to test this model with ALMA Cycle 0 observations of AS 205 and RNO 90. First results were obtained in May 2012, and are summarized in Figure 7 (for AS 205). While the more optically thin 13CO emission displays a velocity field typical of a protoplanetary disk in Keplerian rotation, the more optically thick 12CO emission is noticeably extended, especially towards the red-shifted northwest direction. The CO emission is also quite different from previously observed molecular outflows around class I protostars (e.g. Jorgensen et al., 2007). As shown in Fig. 7, in contrast to Class I molecular outflows, the extended emission is relatively small-scale (~5”), the velocities are low (a few km/s), it is not collimated nor does it resemble an outflow cavity, there is a slight preferential red-shift, and it is not extended preferentially along the disk rotation axis. Instead, it more closely resembles a disk wind, in which the orientation would mimic the underlying disk. In this sense, previous lower resolution disk observations of CO may well be contaminated by wind components, which could help explain the dust:gas radial dichotomy observed in some systems (Andrews et al. 2010).
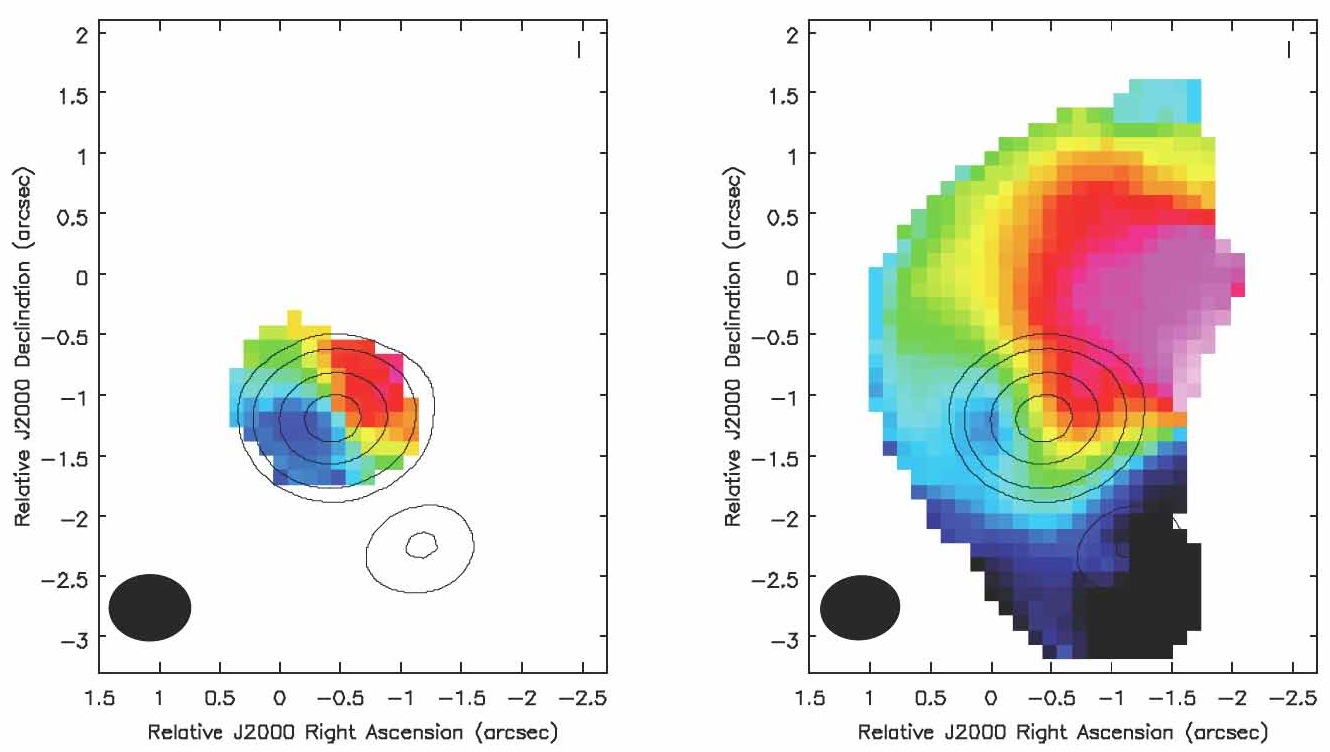
Figure 7.– Cycle 0 ALMA images of AS 205 (N+S with separation ~1.”3). Left panel (color): 13CO J=2-1 intensity-weighted velocity field, showing a pattern typical for a rotating disk. Right panel (color): 12CO J=2-1 intensity-weighted velocity field, showing significant extended emission at relatively low velocities. Contours in both plots show the continuum (contours: 5,15,50,100σ) and velocities are in vLSR.
Finally, because rovibrational lines selectively trace the gas kinematics at ~AU scales, they may ultimately reveal perturbations induced by the presence of newly formed giant planets. Regaly et al. (2010) propose, for example, using multi-dimensional radiative transfer calculations on disk hydrodynamical simulations with embedded planets, that: 1) gas orbits become eccentric under the influence of the planet(s), inducing permanent asymmetries in the CO line profiles, and that 2) secondary asymmetric perturbations are time variable on orbital time scales. They estimate that the M-band line profile perturbations may be detectable at the 5-20% level, relative to the total line strength, and we do find examples of Keplerian-disk CO profiles with variable emission (Figure 8). With support from the Caltech TAC, we have begun a multi-semester spectroscopy/SA search for disk emission line variability.

Figure 8. – Observed CO line shape/contrast variability for the cTTs GQ Lup (left, with CRIRES) and RNO 90 along with the transitional disk DoAr 44 (right, with NIRSPEC) on monthly and yearly time scales. The moderate-J spectrum for GQ Lup is clipped at an atmospheric transmission of <70%, the dashed lines in the NIRSPEC data depict the low impact of the atmosphere near 5 μm. For GQ Lup several transitions are stacked to increase the SNR, while the RNO 90/DoAr 44 data are for the P(38) line. The observed pattern is repeated in the many transitions detected with NIRSPEC.
Importantly, SA is highly sensitive to any departures from axi-symmetry, and, in particular, can measure the PA of the disk itself as well as any perturbation to much greater precision than the spectra alone. This is critical because several sources of variability can be envisioned, and only by isolating the appropriate spatial, kinematic and geometric signatures will the time domain SA of wind-free disks – ultimately in several disk gas tracers (CO, H2O, HCN) over a number of orbital periods – be able to robustly identify orbiting planet-disk interactions.
Herschel Program: The near-to mid-IR program outlined above is not sensitive to water or OH in the outer regions of circumstellar disks where comets are likely to form, nor can they be used to search for more complex organics such as those seen in carbonaceous chondrites. Two major instruments, the Herschel Space Telescope and the Stratospheric Observatory For Infrared Astronomy, have changed this situation dramatically by undertaking the first detailed exploration of the far-IR sky. Prof. Blake is a member of the HEXOS and WISH Key Program Guaranteed Time teams as well as the DIGIT Key Program Open Time team, and with former Hubble Fellow Dr. K. Pontoppidan (P.I.) has an OT-1 program centered on very deep integrations with PACS on a suite of cTTs with strong Spitzer molecular emission. With these data, we are able to characterize the water and OH far-IR emission lines from disks. In combination with the IR data either in hand or to be obtained with NAI support, the Herschel data precisely locate the “snow line” in the disks around T Tauri stars.
Eventually, telescopes such as the TMT or E-ELT may be able to directly image the snow line, but this day is likely many years into the future, however. So, we have begun to investigate whether the smoothly varying conditions in disks enables abundance profiles to be retrieved from even spatially and spectrally unresolved data (provided the lines span a significant range in excitation). We have termed this approach molecular mapping, and first applied it to water data from the Spitzer and Herschel Space Telescopes (see Figure 9, adapted from Zhang et al. 2012). Infrared (inner disk) through (sub)mm (outer disk) data are particularly well suited to this approach, and we find that the high and dry disk surface must remain so out to large distances, in agreement with recent Herschel HIFI studies of the ground state water lines in the DM Tau (Bergin et al. 2010) and TW Hya (Hogerheijde et al. 2011) disks.
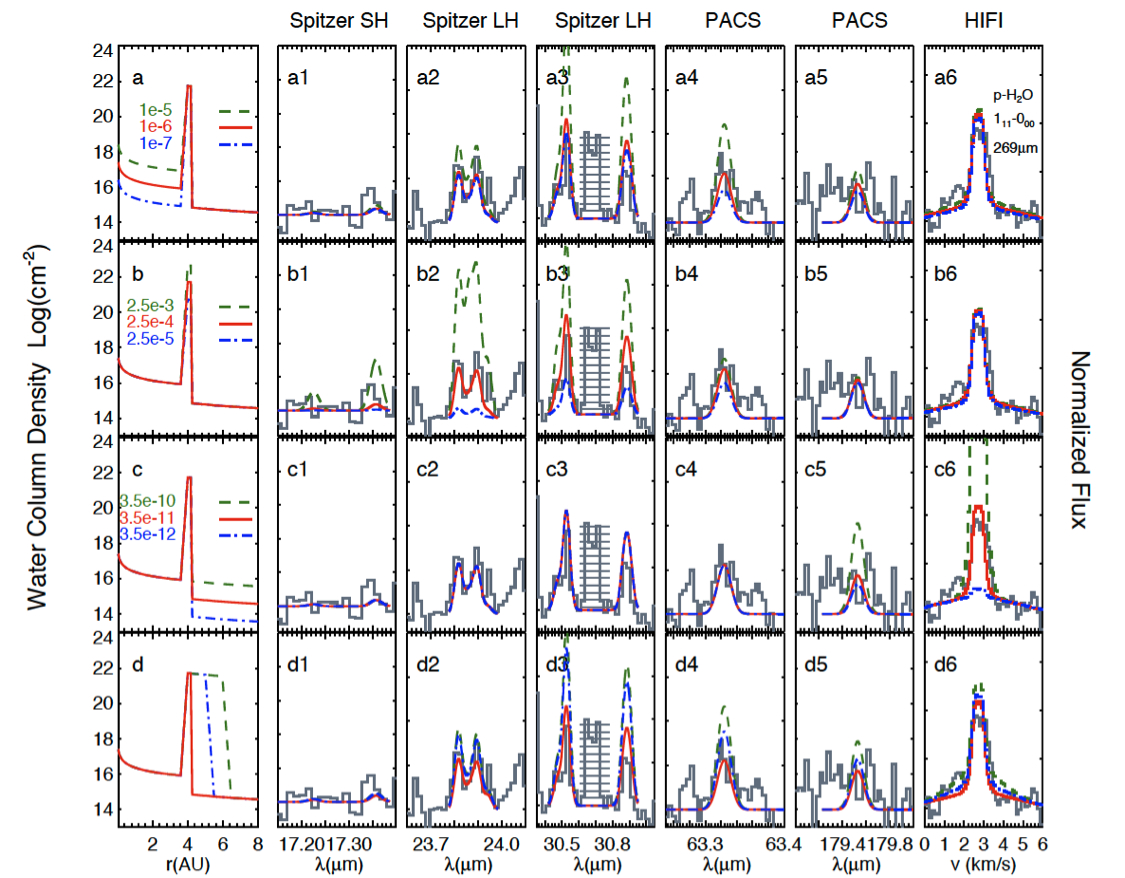
Figure 9. – An illustration of the molecular mapping method, applied to the specific case of TW Hya (adapted from Zhang et al. 2012). The panels illustrate the sensitivity of selected water line fluxes to variations in the prescribed water vapor abundance distribution. The first column shows the model water vapor radial abundance distributions. The best-fit model is the solid red curve, while the green and blue curves are models calculated to illustrate the sensitivity of the various lines to changes in the water abundance at different disk radii. The numbers in the first column indicate the fractional (per hydrogen molecule) water abundance in (a) the optically thin inner disk, (b) the ring at the transition radius (4 AU) and© the outer disk. The final (d) panel shows the sensitivity of the model to the radius of the snow line. The following six columns show model line spectra compared to the observed spectra for TW Hya.
The broad wavelength coverage of Herschel will also permit a much improved understanding of ices in disks, and thus the origin of icy bodies such as comets. Ices are notoriously difficult to detect in circumstellar disks via their otherwise strong mid-IR resonances, simply because any material warm enough to excite these resonances will not retain volatiles. Thus, the SEDs of most disks are dominated by emission from refractory dust grains. Only for a few systems with very favorable, inclined, geometries have ices been seen, and for these systems the potential ice detections disks are difficult to interpret. Herschel will offer the unique chance to observe ices in disks in emission through a number of far-IR resonances, which are excited at temperatures low enough for dust grains to retain their volatile component. These include the known 62 µm lattice mode of water ice, the 85/150 µm features of solid CO2 and the 89 µm feature of CH3OH. All data reduction expenses will be covered by Herschel funds, here we are using the NAI support to, again, collaborate with the Mumma group on the global interpretation of the ice data and how it relates to the measurements of volatiles in comets. Laboratory measurements, described next, are key to this effort.
Because the organics in the inner regions of disks are so closely tied to water, we are also using the HIFI instrument on Herschel to search for gas phase water signatures in the outer regions of disks and in comets, to great effect. In the disk around TW Hya we have detected the ground state ortho and para lines of water for the first time in such objects (Hogerheijde et al. 2011), and we have also made the first measurements of the D/H ratio in water from a Jupiter family comet, specifically Comet 103P Hartley 2 that was the subject of the EPOXI flyby and that we have worked with the Mumma group on infrared observations using Keck in support of the EPOXI and Herschel campaigns. Interestingly, we find that the D/H ratio in Hartley is substantially lower than that in Oort cloud comets, and the same as that in the Earth’s oceans (Hartogh et al. 2011). This substantially enlarges the region of the solar nebula with a “terrestrial” isotopic composition, and highlights the great uncertainties associated with the formation region of comets and the dynamical evolution of the early solar system. For NASA press releases on this work, see http://www.jpl.nasa.gov/news/news.cfm?release=2011-327 (TW Hya) and http://www.jpl.nasa.gov/news/news.cfm?release=2011-312 (Hartley 2), respectively.
3. Proposed Lab Work: The other area we remain active in with NAI support is in the laboratory study of the far-IR modes of complex organics. Searches for the rotational transitions of large molecules using even the most capable new facilities such as the GBT and, soon, ALMA are becoming increasingly constrained by spectral line confusion where it is the overlapping emission from the many molecules present and not instrument performance that limits the search “sensitivity.” Thankfully, Herschel now offers (as does SOFIA) dramatically new opportunities for the discovery of complex extraterrestrial organics through searches for the lowest frequency torsional or bending vibrations of molecules. With such modes both polar and non-polar species maybe examined, in either the gas phase or in the solid state, just as in the mid-IR. Furthermore, the spectral line confusion should be eased by the “spreading out” of the low energy vibrations, and complete rotational resolution for systems in excess of 30 atoms in size should be readily possible (at least in the lab).
For organics some 20-25 atoms in size with gas phase abundances 10-12 that of H2, the expected band/continuum ratio for high mass protostars is several percent. In addition to the previously outlined programs, the “HEXOS: Herschel Observations of EXtra-Ordinary Sources: The Orion and Sgr B2 Star-Forming Regions” (E. Bergin, P.I.) KP GT surveys will reach much deeper than this over the full HIFI and PACS ranges. The achieved RMS demonstrates the expected fall off in the pure rotational envelope of small-to-moderate sized gas phase species (Crockett et al. 2010), meaning that sensitive searches for more complex species (amino acids, sugars, etc.) are now possible. Thus, there is every expectation that new discoveries can be made. Nearly nothing is known about these modes, however, and so they must be measured in the laboratory first. The challenging nature of far-IR studies should not be underestimated, however, since the generality and uniqueness to molecular structure associated with such low energy torsions/vibrations comes at a price. These dynamically complex modes are extremely difficult to predict theoretically, and so the search space is very large (unlike that at microwave frequencies).
Using (principally) NSF instrumentation support, primarily, we have recently constructed two TeraHertz Time Domain Spectrometers, or THz TDSs, and are supplementing these instruments with a new chirped pulse Fourier Transform microwave instruments for further gas phase studies. With these laboratory light sources we now have complete coverage of the spectral ranges accessible to Herschel/SOFIA (and ALMA/VLA) at a dynamic range of >106 and without any need for cryogens (Figs. 10-14). The workhorse system we have been using over the past year for solid state/ice studies is driven by a kHz repetition rate regenerative amplifier system (Figure 10) and either electro-optic generation and detection or the production of intense THz pulses via plasma filamentation in air (Figure 11), which requires larger pulse energies than Ti:Sapphire oscillators can deliver. The amplifier has less spectroscopic resolution than the dual oscillator THz TDS we also use in the laboratory, but has a bandwidth well beyond 10 THz (Figure 11) and so covers all of the Herschel instruments and beyond.
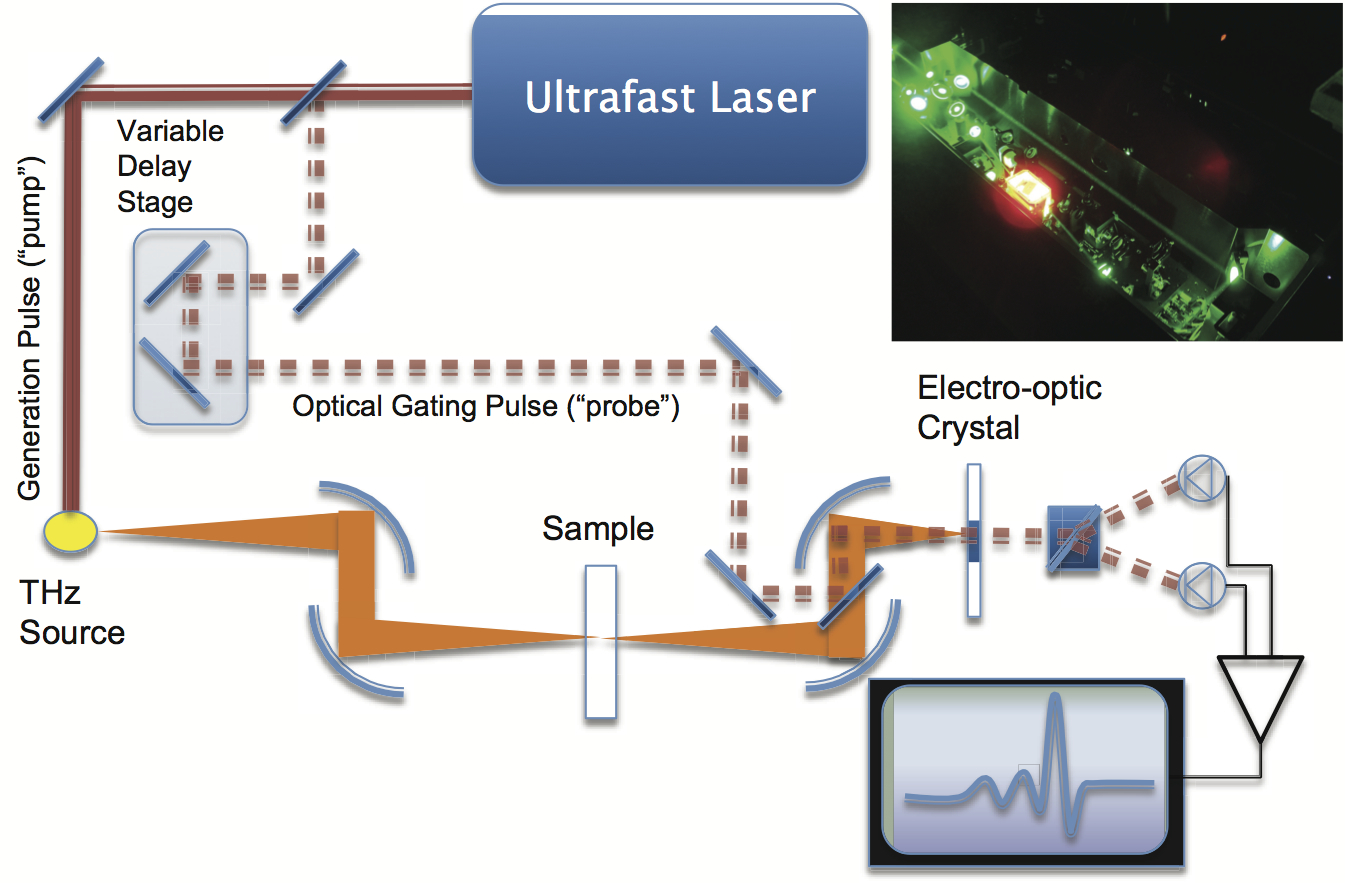
Figure 10. – Schematic diagram of the Caltech Ti:Sapphire regenerative amplifier-driven THz TDS, based on plasma filamentation and electro-optic sampling in ZnTe and GaSe. The Coherent Legend Elite amplifier provides <25-30 femtosecond 800 nm pulses at 1 kHz (pulse energy >4 mJ).
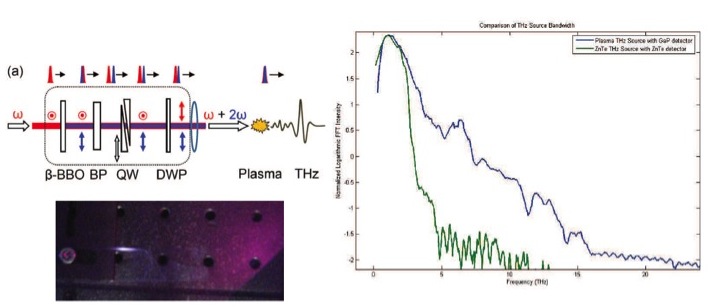
Figure 11. – (Left) Schematic diagram of the plasma filamentation THz source (image below). The purple coloration in the image is scattered optical light from the plasma. (Right) Demonstration of the tremendous increase in THz bandwidth provided by plasma filamentation (as opposed to E-O generation in ZnTe, the green curve).
Specifically, we us a Coherent Legend Elite UltraShort Pulse (USP) THz TDS system that delivers <30 fs pulses of energy >4 mJ at a repetition rate of 1 kHz, and have built up separate computer control software and hardware so that the dual oscillator and regen Ti:Sapphire experiments can run independently. Each system uses its own THz emitter/detector and sample handling systems. For the regen-based system the repetition rate is sufficiently low that an optical delay line is needed both to generate the appropriate pump/probe scans but also to acquire the THz time domain data. Dr. Sergio Iopplo, who constructed the Sackler Laboratory ice surface chemistry machines at the Sterrewacht Leiden, has been in residence in Pasadena for the past year as a Curie Postdoctoral Fellow, and has built up the cryostat system outlined in Fig. 12, that incorporates both FT-IR and THz TDS probes. The cryostat can operate down to temperatures of <10 K, as shown in the glutamic acid data presented in Fig. 13, and we can extract both the real and imaginary indices of refraction over the full range of wavelengths accessible to the THz TDS.
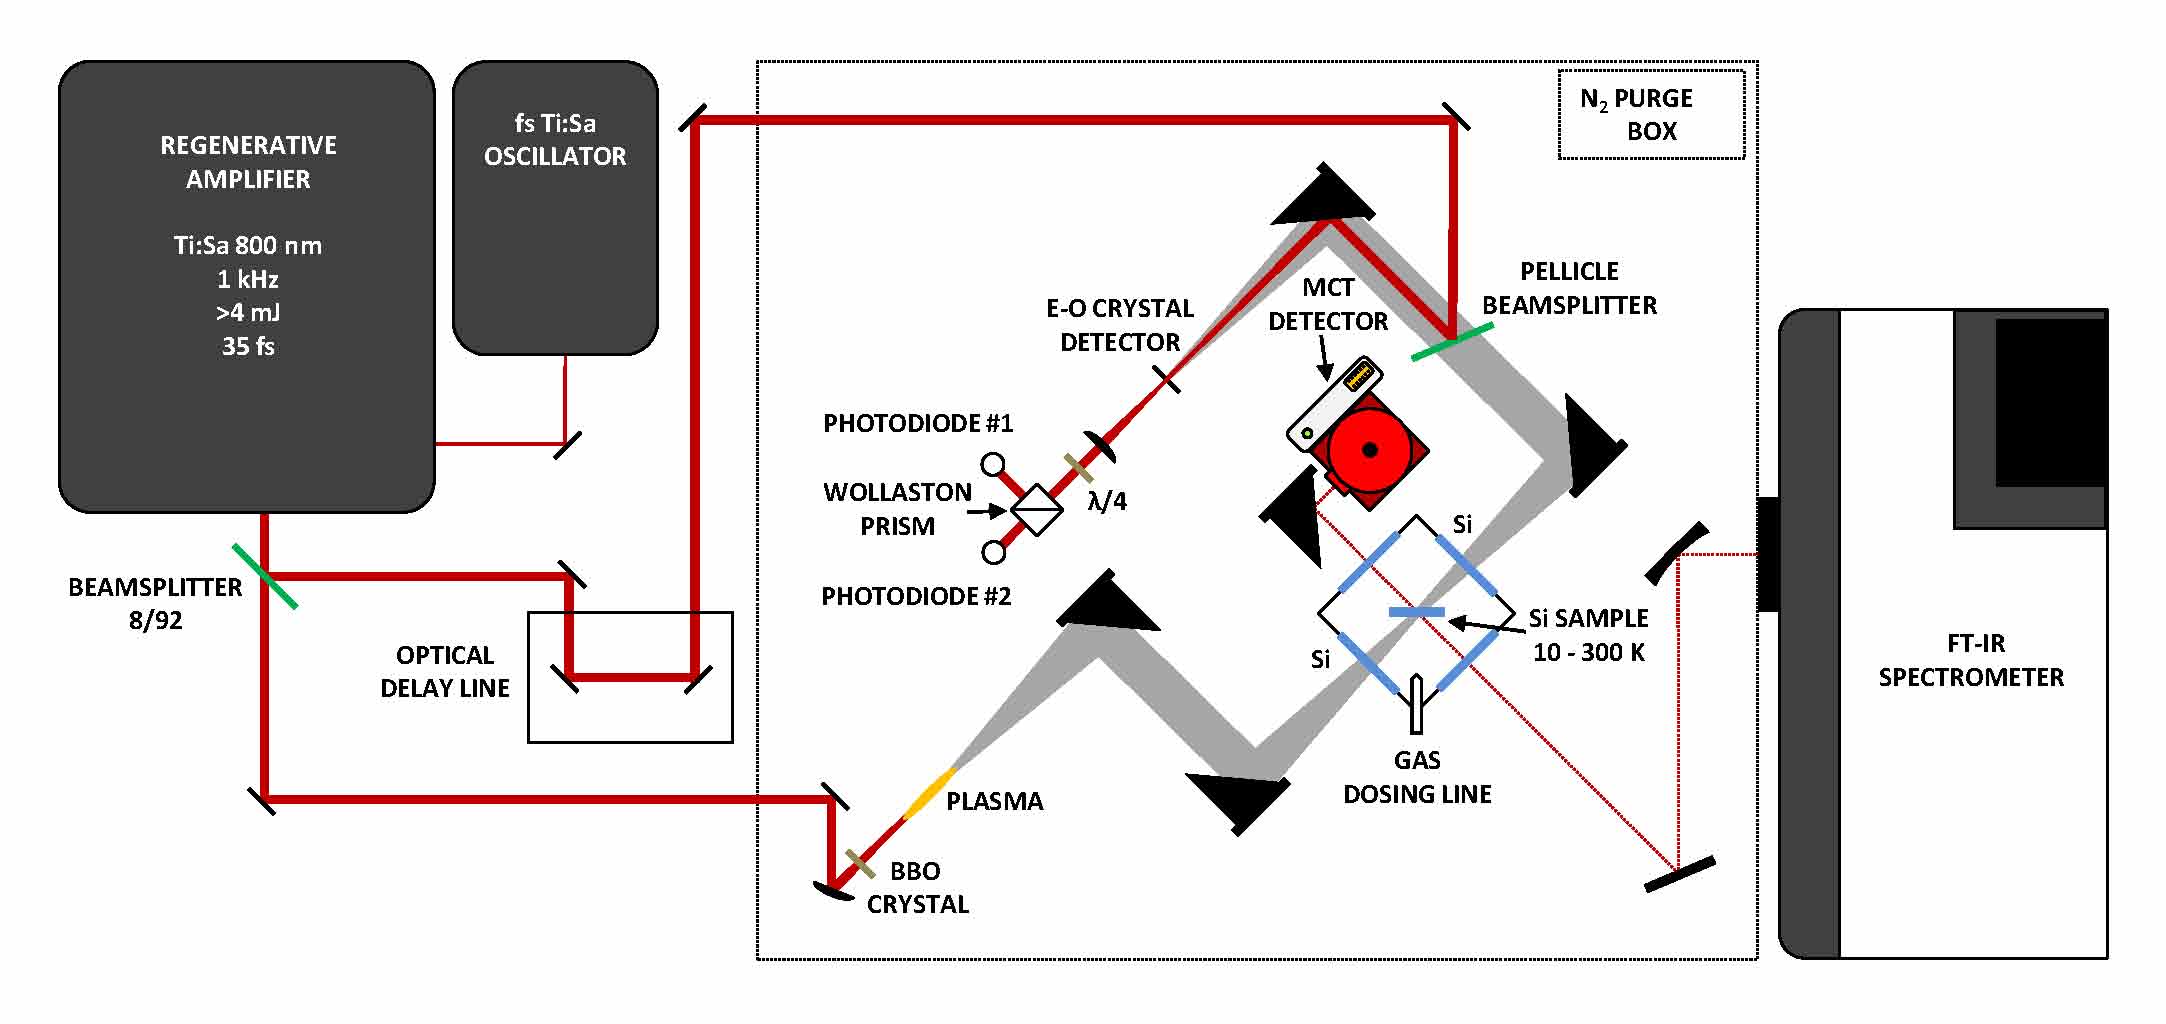
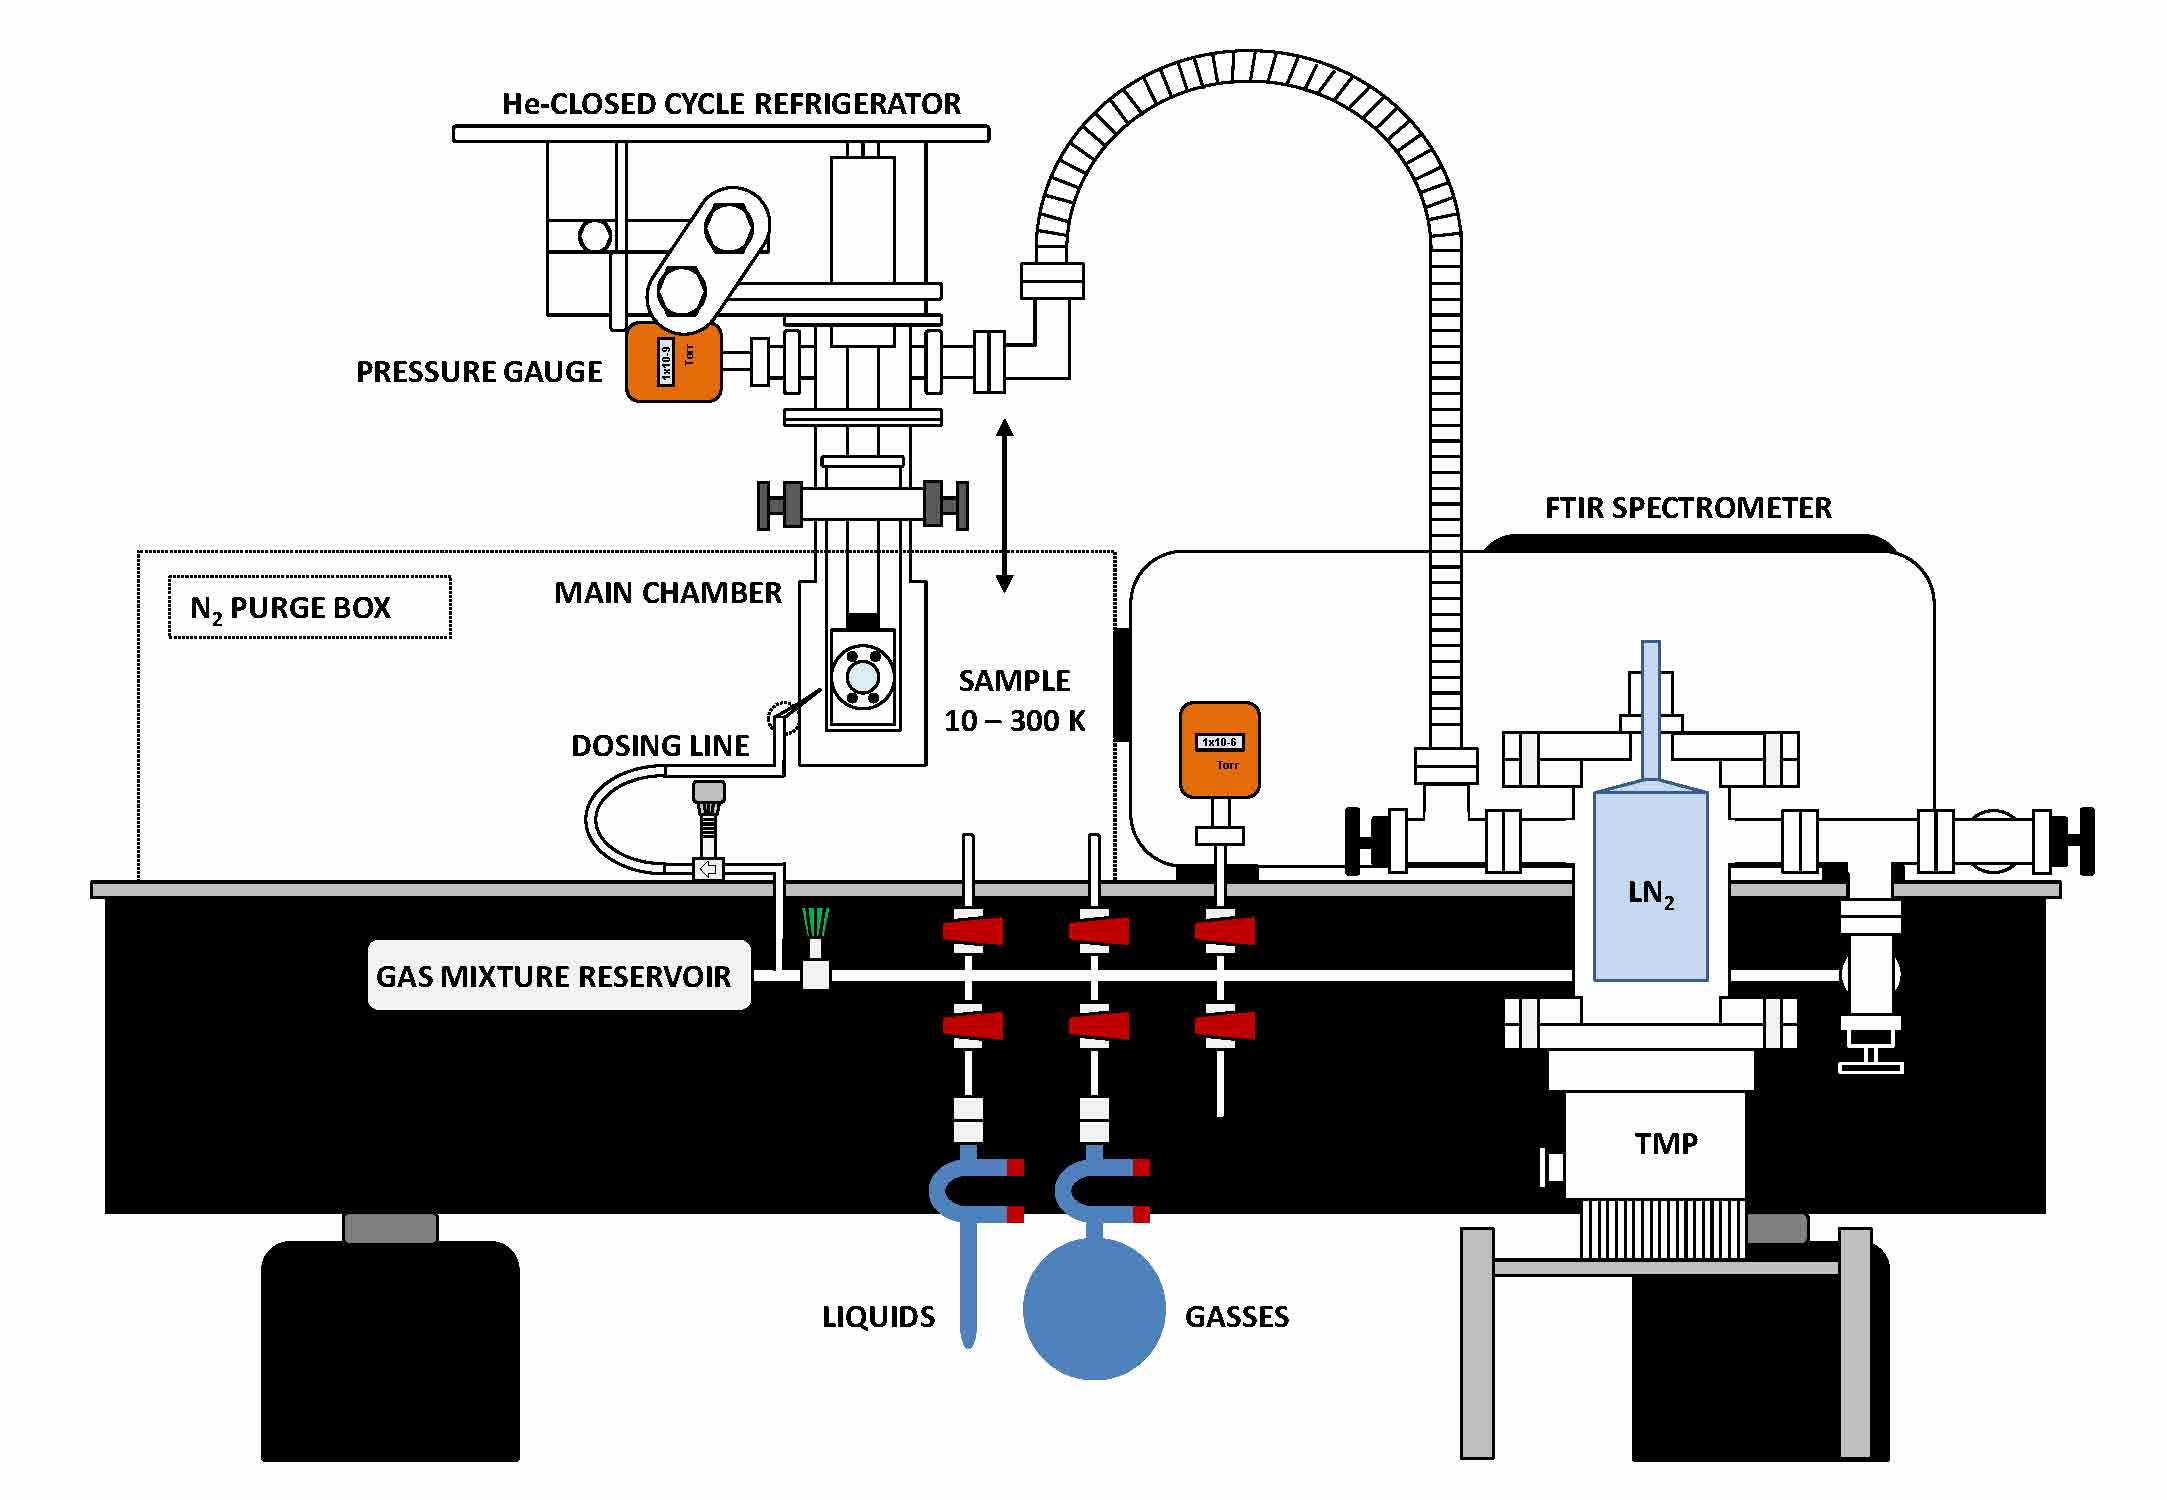
Figure 12. – Schematic top (left) and side (right) views of the Caltech THz TDS/ice cryostat spectrometer. FT-IR measurements are used to measure the film thicknesses, and are acquired simultaneously with the THz data.

Figure 13. – THz TDS spectra of glutamic acid, acquired with the cryostat and optical system outlined in Figures 10/11. Note the sharpening of the bands as the temperature is decreased.
With this THz TDS/FT-IR suite of instruments now operational, we can rapidly assess the possibility of detecting features from a variety of materials, be they molecular ices (water, carbon dioxide, mixtures, etc.), silicates or other dust grain candidate samples, or complex organics, with Herschel due to the broad coverage and high dynamic range that can be achieved. In addition to the graduate students supported by this grant, we have been fortunate to involve several talented undergraduates in the NAI research program over the past three summers, and they have brought into function a number of new capabilities.
For the study of organic and hydrogen bonded materials we employ a multistep approach in, which we first measure solid state films in THz waveguides (Laman et al. 2008), and then move to matrix isolation and ultimately to gas phase studies. In this way, the truly intramolecular modes (that are of interest to Herschel) can be separated from the intermolecular degrees of freedom that also display bands in the more easily prepared hydrogen bonded film samples. The necessary sample cells and cold head are operational, and summary temperature dependent data on glutamic acid is shown in Fig. 13. We have also acquired data on additional amino acid crystals (gamma amino-isobutyric acid (GABA), glycine, alanine, etc.) along with a range of sugar molecules. Because the range of possible compounds to be studied is so vast, we have concentrated on the sugars and amino acids seen in carbonaceous chondrites (along with their expected precursors).
Once the moderate resolution solid-state data are in hand, we then turn to high resolution studies using the dual oscillator Asynchronous OPtical Sampling system. A schematic of the THz ASOPS system may be found in Fig. 14, along with a display of low pressure water vapor data acquired with only a few seconds of integration time. The present system generates >30,000 point THz waveforms that are averaged at >kHz repetition rates, with coverage up to 3-4 THz. To acquire such data, the jitter in the two independent oscillators must be reduced to <<100 fs, a difficult feat that has been accomplished by Mr. Dan Holland, a graduate student in the Blake group, and supported in part by this grant. The next generation of locking circuitry is now ready for implementation, this plus improvements to the large area semiconductor THz emitter should push the usable bandwidth to >6 THz, and again provide complete coverage of the Herschel HIFI and PACS instrument passbands. We combine the data from the THz ASOPS system with high precision microwave studies of the ground and excited torsional states of complex organics to produce fully rotationally resolved predictions of the THz bands that can be used to guide searches with Herschel, SOFIA, or ALMA. Over the coming months Mr. Holland will be using the new ASOPOS system and the cryostat to investigate the nuclear spin dynamics in water and ammonia.

Figure 14. – Schematic diagram of the dual Ti:Sapphire oscillator THz asynchronous optical sampling spectrometer. The frequency resolution is ~100 MHz, and the water vapor spectrum shown at bottom was acquired in only a few seconds of wall-clock time. Continuing improvements in the laser jitter/lock circuits and in the large area THz emitter should extend the usable range of this instrument to at least 6 THz before the end of the calendar year.
References:
Acke, B., van den Ancker, M.E., & Dullemond, C.P. 2005, A&A, 436, 209
Alexander, R.D., Clarke, C.J., & Pringle, J.E. 2006, MNRAS, 369, 229
Andrews, S. et al. 2010, ApJ , 723, 1241
Bergin, E.A. et al. (14 authors) 2012, Nature, revised manuscript in review
Blake G.A. & Boogert, A.C.A. 2004, ApJ, 606, L73 Boogert, A.C.A. et al. 2004, ApJS, 154, 359
Boonman, A.M.S. et al. 2000, ApJ, 553, L63
Carr, J.S. et al. 2004, ApJ, 603, 213; Carr, J.S. & Najita, J. 2008, Science, 319, 1504
Ciesla, F.J., & Cuzzi, J.N. 2006, Icarus, 181, 178
Crockett, N.R., Bergin, E.A.Wang, S. et al. 2010 (63 authors), A&A, 521, L21
Dullemond, C.P. et al. 2006, Protostars & Planets V, 555
Eisner, J.A. 2007, Nature, 447, 562
Evans, N.J. et al. 2003, PASP, 115, 965
Furlan, E. et al. 2006, ApJS, 165, 568
Hartogh, P. et al. (12 co-authors) 2011, Nature, 478, 7367
Hogerheijde, M. et al. (14 co-authors) 2011, Science, 334, 338
Jorgensen, J. et al. (11 co-authors) 2007, ApJ, 659, 479
Klatt, G., Gebs, R., Janke, C., Dekorsy, T., & Bartels, A. 2009, Optics Express, 17, 22847
Laman, N., Sree, S., Harsha, S., Grischkowsky,D., & Melinger, J. 2008, Biophys. J., 94, 1010
Lahuis, F. et al. 2006, ApJ, 626, L145
Mandell, A. et al. 2008, ApJ, 681, L25
Mandell, A., Deming, D., Blake, G.A., Knutson, H., & Mumma, M. 2011, ApJ, 728, A18
Mandell, A., Bast, J., van Dishoeck, E.F., Blake, G.A., Salyk, C., Mumma, M.J., & Villanueva, G. 2012, ApJ, 747, 92
Meijerink, R., Pontoppidan, K.M., Blake, G.A. et al. 2009, ApJ, 704, 1471
Pontoppidan, K. et al. 2008,ApJ,684,1323 (AO-fed spectro-astrometry w/VLT-CRIRES)
Pontoppidan, K., Meijerink, R., Dullemond, C.P. & Blake, G.A. 2009, ApJ, 704, 1482
Pontoppidan, K.M., Salyk, C., Blake, G.A., Meijerink, R., Carr, J. & Najita, J. 2010a, ApJ, 720, 887
Pontoppidan, K.M., Blake, G.A., Salyk, C. & Kaufl, H. 2010b, ApJ, 722, L173
Pontoppidan, K.M., Blake, G.A. & Smette, A. 2011, ApJ, 733, 84
Regaly, Zs., Sandor, Zs., Dullemond, C.P., & van Boekel, R. 2010, A&A, 523, A69
Salyk, C., Blake, G.A. et al. 2007, ApJ, 655, L105; ibid 2009, ApJ, 699, 330
Salyk, C., Pontoppidan, K., Blake, G.A. et al. 2008, ApJ, 676, L49
Salyk, C., Pontoppidan, K.M., Blake, G.A., Carr, J. & Najita, J. 2011, ApJ, 731, 130
Shiba, H., Sato, S., Yamashita, T., Kobayashi, Y., & Takami, H. 1993, ApJS, 89, 299
Stevenson, D.J. & Lunine, J.I. 1988, Icarus, 75, 146
Swain, M.R., Vasisht, G., & Tinetti, G. 2008, Nature, 452, 329
Terada, H. et al. 2007, ApJ, 667, 303
Watson, D.M. et al. 2007, Nature, 448, 1026
Publications
-
Burton, A. S., Elsila, J. E., Callahan, M. P., Martin, M. G., Glavin, D. P., Johnson, N. M., & Dworkin, J. P. (2012). A propensity for n-ω-amino acids in thermally altered Antarctic meteorites. Meteoritics & Planetary Science, 47(3), 374–386. doi:10.1111/j.1945-5100.2012.01341.x
-
Burton, A. S., Stern, J. C., Elsila, J. E., Glavin, D. P., & Dworkin, J. P. (2012). Understanding prebiotic chemistry through the analysis of extraterrestrial amino acids and nucleobases in meteorites. Chem. Soc. Rev., 41(16), 5459. doi:10.1039/c2cs35109a
-
Elsila, J. E., Charnley, S. B., Burton, A. S., Glavin, D. P., & Dworkin, J. P. (2012). Compound-specific carbon, nitrogen, and hydrogen isotopic ratios for amino acids in CM and CR chondrites and their use in evaluating potential formation pathways. Meteoritics & Planetary Science, 47(9), 1517–1536. doi:10.1111/j.1945-5100.2012.01415.x
-
Fletcher, L. E., Conley, C. A., Valdivia-Silva, J. E., Perez-Montaño, S., Condori-Apaza, R., Kovacs, G. T. A., … McKay, C. P. (2011). Determination of low bacterial concentrations in hyperarid Atacama soils: comparison of biochemical and microscopy methods with real-time quantitative PCR. Canadian Journal of Microbiology, 57(11), 953–963. doi:10.1139/w11-091
-
Glavin, D. P., Elsila, J. E., Burton, A. S., Callahan, M. P., Dworkin, J. P., Hilts, R. W., & Herd, C. D. K. (2012). Unusual nonterrestrial l-proteinogenic amino acid excesses in the Tagish Lake meteorite. Meteoritics & Planetary Science, 47(8), 1347–1364. doi:10.1111/j.1945-5100.2012.01400.x
-
Parker, E. T., Cleaves, H. J., Callahan, M. P., Dworkin, J. P., Glavin, D. P., Lazcano, A., & Bada, J. L. (2011). Enhanced Synthesis of Alkyl Amino Acids in Miller’s 1958 H2S Experiment. Orig Life Evol Biosph, 41(6), 569–574. doi:10.1007/s11084-011-9253-2
-
Stalport, F., Glavin, D. P., Eigenbrode, J. L., Bish, D., Blake, D., Coll, P., … Mahaffy, P. R. (2012). The influence of mineralogy on recovering organic acids from Mars analogue materials using the “one-pot” derivatization experiment on the Sample Analysis at Mars (SAM) instrument suite. Planetary and Space Science, 67(1), 1–13. doi:10.1016/j.pss.2012.02.010
-
PROJECT INVESTIGATORS:
-
PROJECT MEMBERS:
Geoffrey Blake
Co-Investigator
-
RELATED OBJECTIVES:
Objective 1.1
Formation and evolution of habitable planets.
Objective 1.2
Indirect and direct astronomical observations of extrasolar habitable planets.
Objective 3.1
Sources of prebiotic materials and catalysts
Objective 7.2
Biosignatures to be sought in nearby planetary systems