2010 Annual Science Report
 NASA Jet Propulsion Laboratory - Titan
Reporting | SEP 2009 – AUG 2010
NASA Jet Propulsion Laboratory - Titan
Reporting | SEP 2009 – AUG 2010
Task 2.1.2.1 Atmospheric State and Dynamics
Project Summary
The physical conditions in the Titan atmosphere set the context for the formation of organic compounds in the atmosphere.
Project Progress
In the past year Co-Investigator Claire Newman, in collaboration with Co-Investigator Mark Richardson, has made significant progress in a representation of the physical and dynamical state of Titan’s stratosphere. The initial version of their 3D numerical model, TitanWRFv1, underpredicted the observed superrotation by almost an order of magnitude. As of a year ago, they had removed all sub-grid scale horizontal diffusion from the model dynamics, allowing the prediction of strong zonal wind jets and equatorial superrotation of the magnitude observed; however this version of TitanWRF (v2) was unstable and soon developed unrealistic temperature and wind gradients around the poles, then crashed. The current version (TitanWRFv3) uses improved polar boundary conditions and polar filtering to prevent instabilities, and now produces realistic temperatures and zonal winds compared with Cassini CIRS results (Newman et al., submitted to Icarus, 2010) as demonstrated in Figures 1 and 2, respectively.
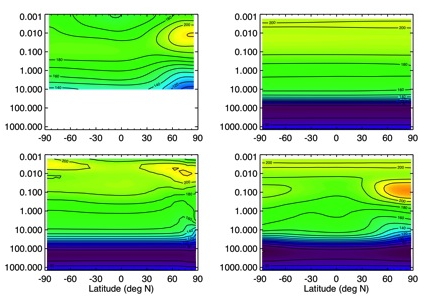
Figure 1 – Zonal-mean temperatures (K) for Ls ~293°-323° as a function of latitude (in deg N) and pressure (in mbar), retrieved from Cassini CIRS data (top left, provided by the Cassini dynamics team using the techniques of Achterberg et al. [2008]), and as modeled by TitanWRF v1 (top right), TitanWRF v2 (using zero horizontal diffusion, bottom left) and TitanWRF v3 (using zero diffusion version and improved treatment of polar regions, bottom right). The TitanWRF v3 results are taken from a fully ‘spun-up’ year of our standard simulation (year 75).
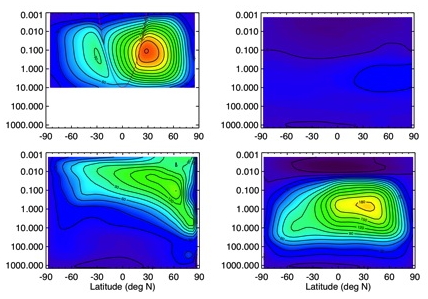
Figure 2 – As in Figure 1, but showing zonal-mean zonal winds (m/s). The top left plot shows winds inferred from CIRS temperatures as in Flasar et al. [2005]. The red line shows the latitudinal limit of the gradient wind balance assumption, and winds are linearly interpolated across this region.
The major outstanding issue is that peak temperatures and winds occur ~60km lower than observed. This may be because the model top is too low, or because TitanWRFv3 excludes haze transport, which is necessary to produce a realistic haze distribution and associated heating rates, and to enable feedbacks between haze microphysics, the temperature distribution and thus circulation.
References:
Newman, C.E., C. Lee, Y. Lian, M.I. Richardson and A.D. Toigo, “Titan’s stratospheric circulation in the TitanWRF model and comparisons with Cassini-Huygens data”, submitted to Icarus, 2010.
-
PROJECT INVESTIGATORS:
-
RELATED OBJECTIVES:
Objective 1.1
Formation and evolution of habitable planets.
Objective 2.2
Outer Solar System exploration
Objective 3.1
Sources of prebiotic materials and catalysts
Objective 3.2
Origins and evolution of functional biomolecules
Objective 3.3
Origins of energy transduction
